
- Moving the markets
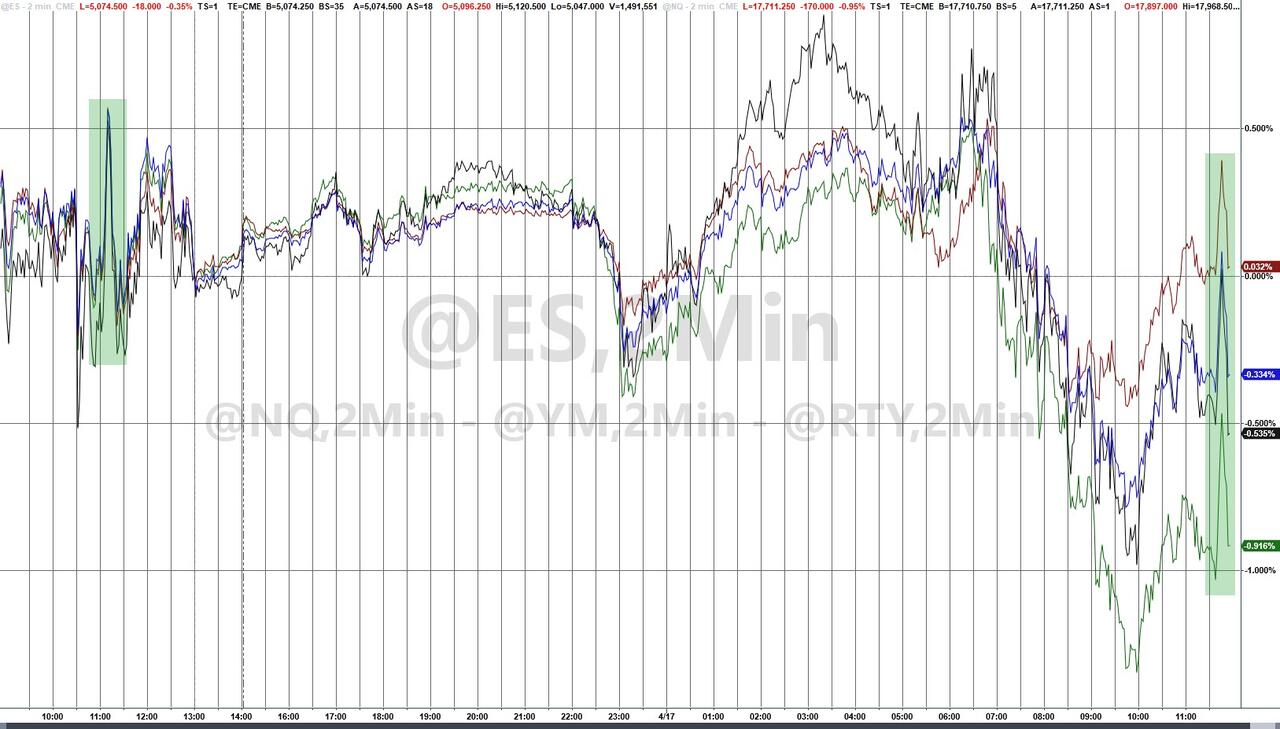
The S&P 500 extended its losing streak, dropping for a fourth consecutive session. Struggling technology stocks, including Nvidia, exerted downward pressure on the market. Interestingly, this is the third straight session where stocks opened higher but then faded throughout the day.
Early in the trading day, stocks were sliding after the opening. However, around 10:55 AM ET, a headline about STRIKING IRAN’S NUCLEAR FACILITIES caught investors’ attention and led to an aggressive decline in stock prices.
Despite the recent volatility, the earnings season has kicked off on a promising note. While less than 10% of S&P 500-listed companies have reported financial results so far, more than three out of every four have exceeded Wall Street expectations.
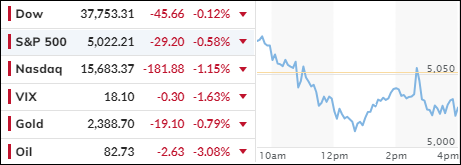
The Dow managed to break its six-day losing streak thanks to UnitedHealth’s post-earnings rally. However, both the S&P 500 and the Nasdaq Composite experienced three consecutive days of declines.
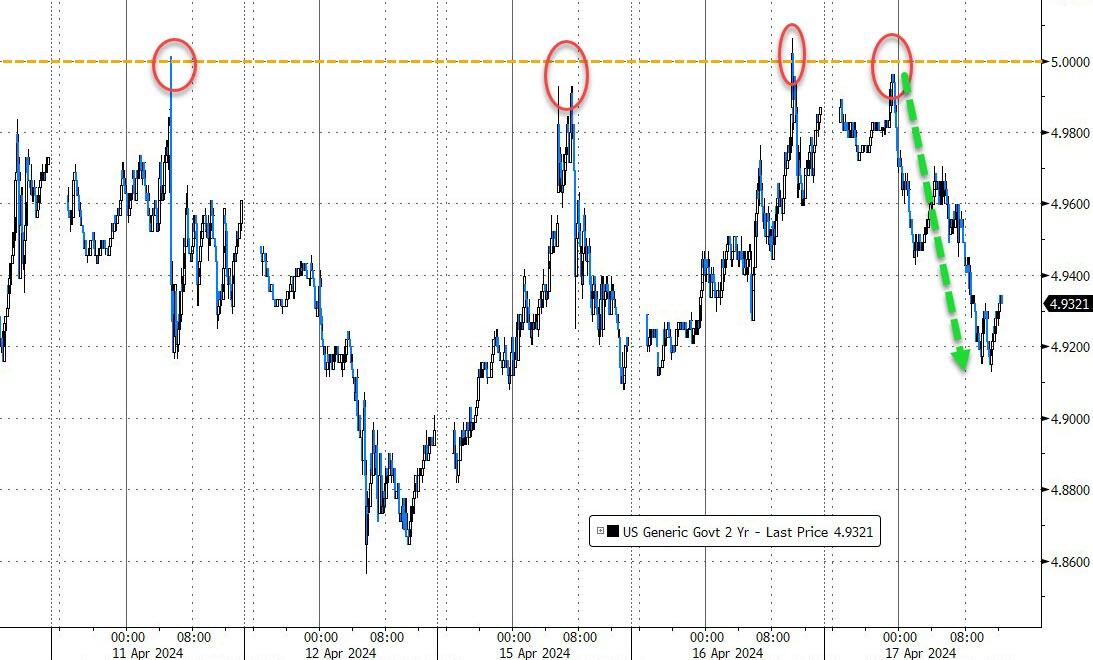
On Tuesday, Federal Reserve Chair Jerome Powell emphasized that the central bank needs to see further progress on the inflation front before considering rate cuts. Meanwhile, the U.S. 2-year Treasury yield remained relatively stable after briefly crossing the 5% mark following Powell’s remarks.
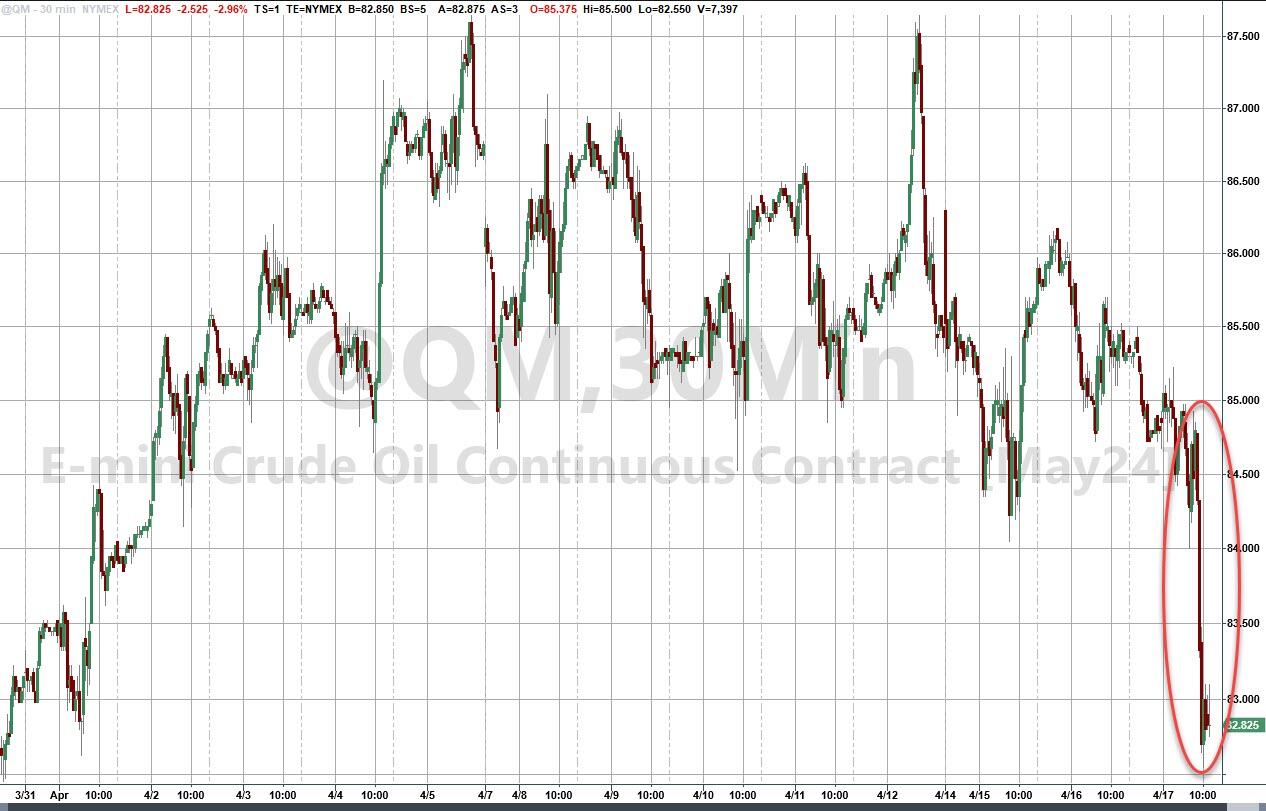
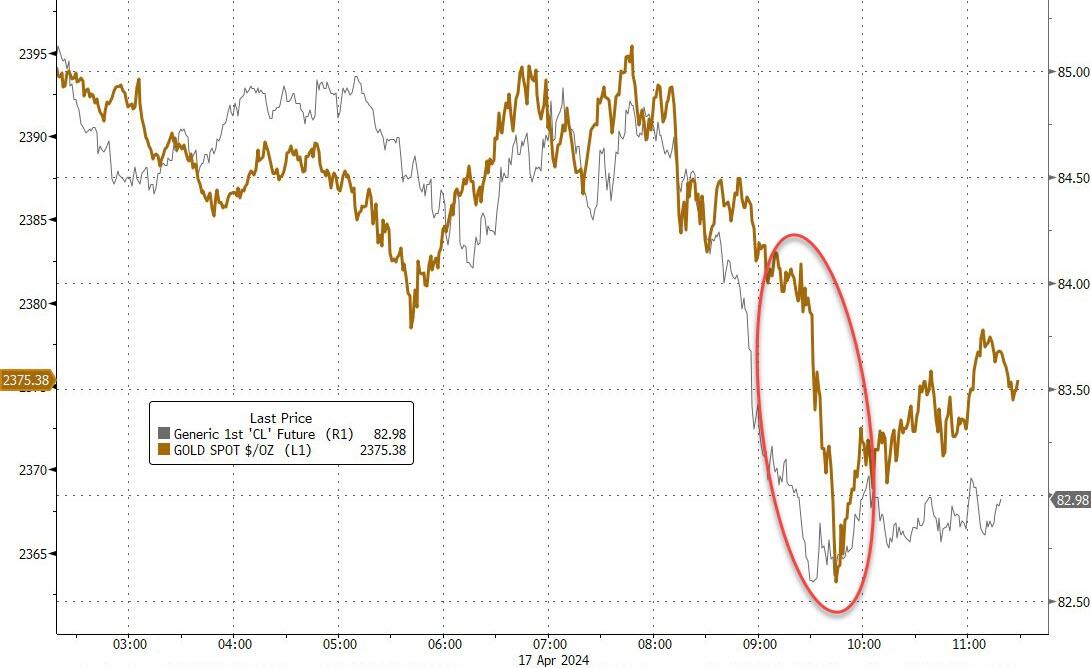
In the commodities market, crude oil initially drifted lower due to a larger stockpile build, but then Venezuela’s Maduro and SPR headlines caused a sharp price drop to three-week lows. Gold also tumbled, resulting in a losing session.
The trading session took an unexpected turn at 2 PM ET, with stocks going vertical for no apparent reason, only to reverse just as quickly—an almost perfect repeat of the previous day’s pattern.
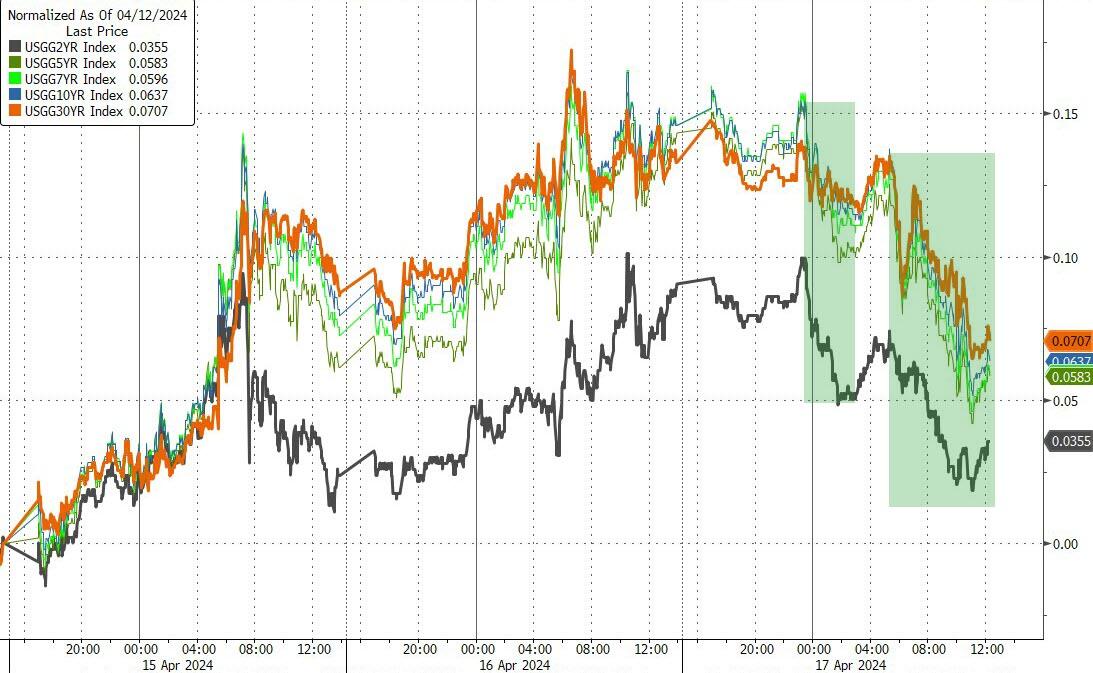
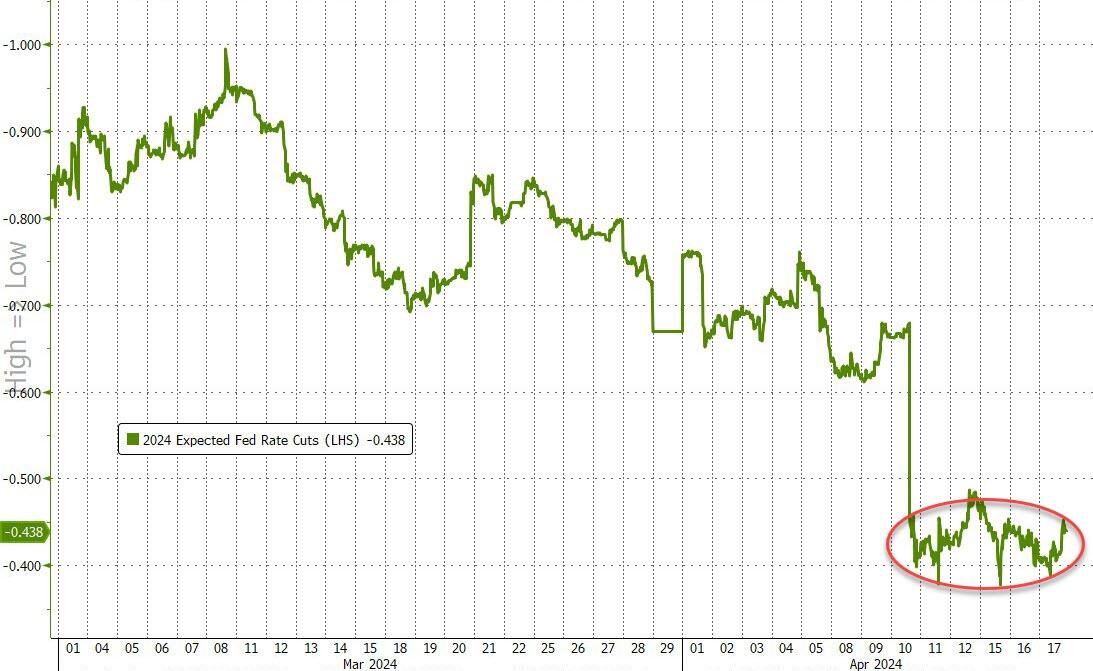
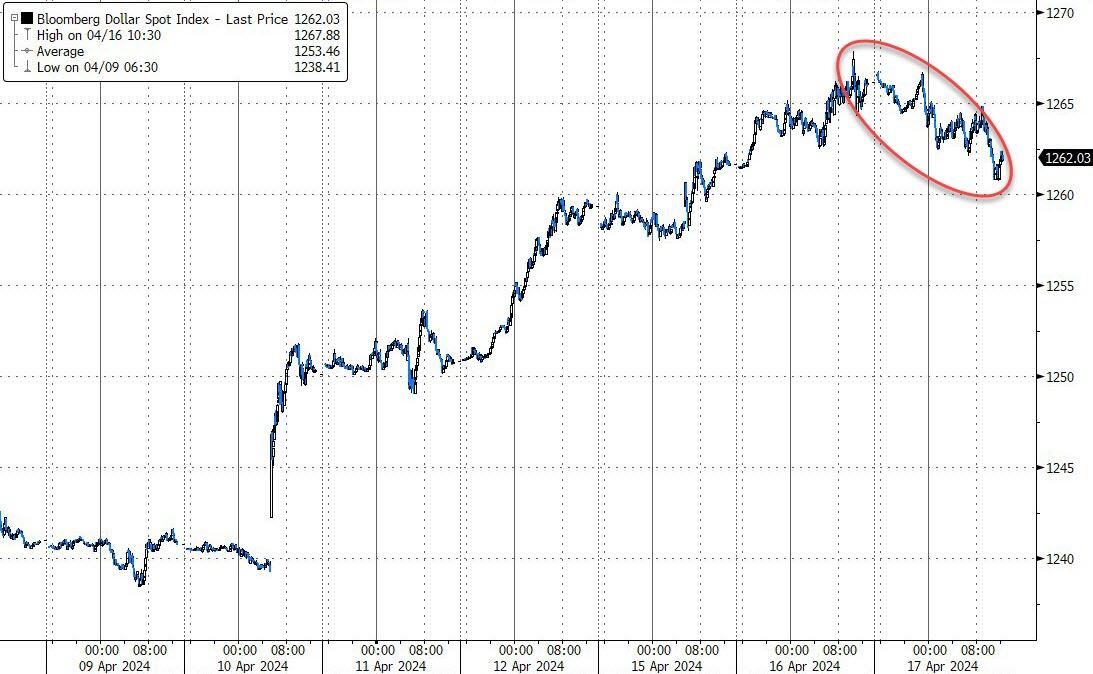
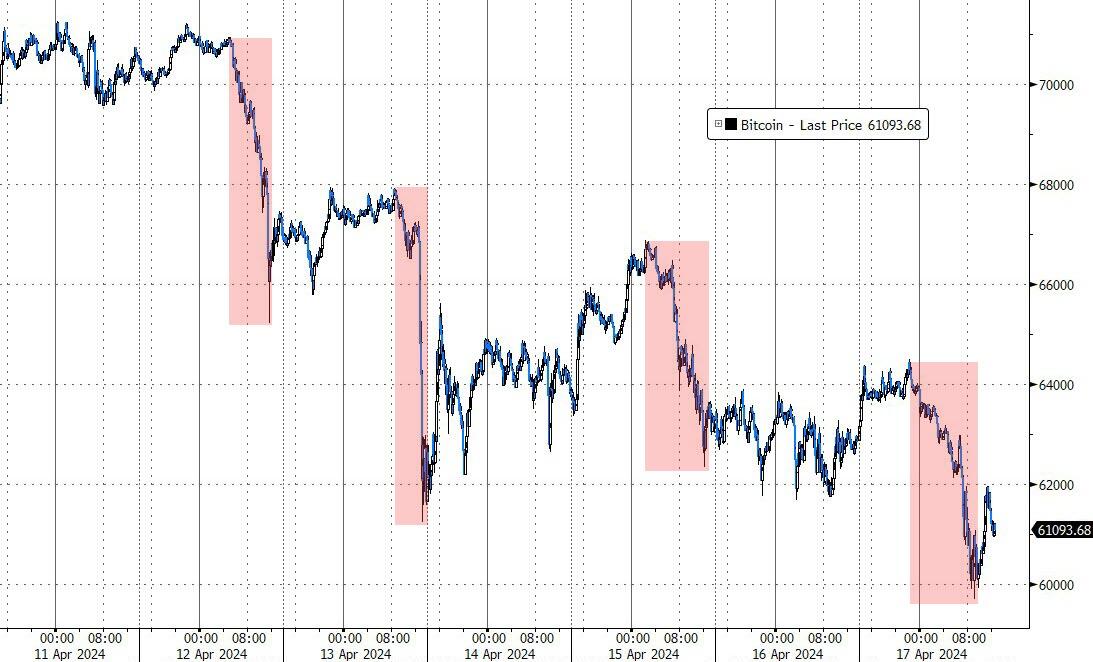
Bond yields finally fell, providing some relief to bond holders. The 2-year yield rejected the 5% level, and rate-cut expectations remained unchanged. Additionally, the U.S. dollar declined for the first time in six days, while Bitcoin found support around the $60,000 level.
So far, the S&P’s historical 2nd half April performance has not come into play yet:
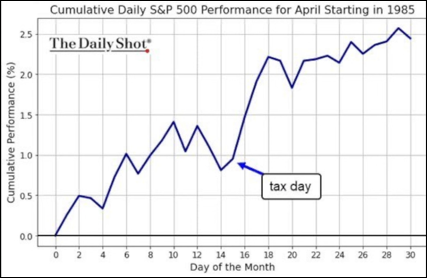
Can history override current market realities?
2. Current “Buy” Cycles (effective 11/21/2023)
Our Trend Tracking Indexes (TTIs) have both crossed their trend lines with enough strength to trigger new “Buy” signals. That means, Tuesday, 11/21/2023, was the official date for these signals.
If you want to follow our strategy, you should first decide how much you want to invest based on your risk tolerance (percentage of allocation). Then, you should check my Thursday StatSheet and Saturday’s “ETFs on the Cutline” report for suitable ETFs to buy.
3. Trend Tracking Indexes (TTIs)
During another volatile session, an early rally quickly fizzled out, and bearish sentiment dominated. As a result, the major stock indexes ended the day in the red.
Our TTIs also participated but experienced only minor declines.
This is how we closed 4/17/2024:
Domestic TTI: +5.06% above its M/A (prior close +5.27%)—Buy signal effective 11/21/2023.
International TTI: +5.48% above its M/A (prior close +5.46%)—Buy signal effective 11/21/2023.
All linked charts above are courtesy of Bloomberg via ZeroHedge.
———————————————————-
WOULD YOU LIKE TO HAVE YOUR INVESTMENTS PROFESSIONALLY MANAGED?
Do you have the time to follow our investment plans yourself? If you are a busy professional who would like to have his portfolio managed using our methodology, please contact me directly to get more details.
—————————————————————-
Contact Ulli