
[Chart courtesy of MarketWatch.com]
- Moving the markets
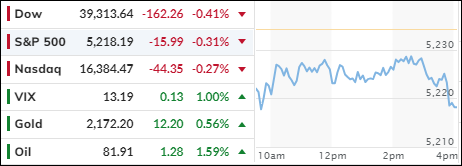
Today, Wall Street’s recent surge took a pause, leading to a dip in stock values as the trading week commenced. Despite this, the market is poised for its fifth straight month of gains, with major U.S. stock benchmarks reaching unprecedented closing highs just last week. The S&P 500 saw an increase of approximately 2.3%, the Dow Jones Industrial Average edged closer to the 40,000 level with a nearly 2% rise, and the Nasdaq Composite climbed about 2.9%.
These upward trends were propelled by the Federal Reserve’s reaffirmation of its rate-cutting schedule for the year and the continued excitement over tech stocks, spurred by an AI-driven rally. Although the American Association of Individual Investors Sentiment Survey indicates that overall investor sentiment is still above average, concerns linger about the repercussions of a prolonged rally and persistently high interest rates.
Historical analysis of Federal Reserve rate cycles since the 1970s suggests that the initial rate cut in a cycle poses a greater threat to investors than the subsequent pause. This week, the release of the February personal consumption expenditures price index (PCE) will shed light on inflation trends. However, the market’s response will only be observed the following Monday due to the Good Friday holiday.
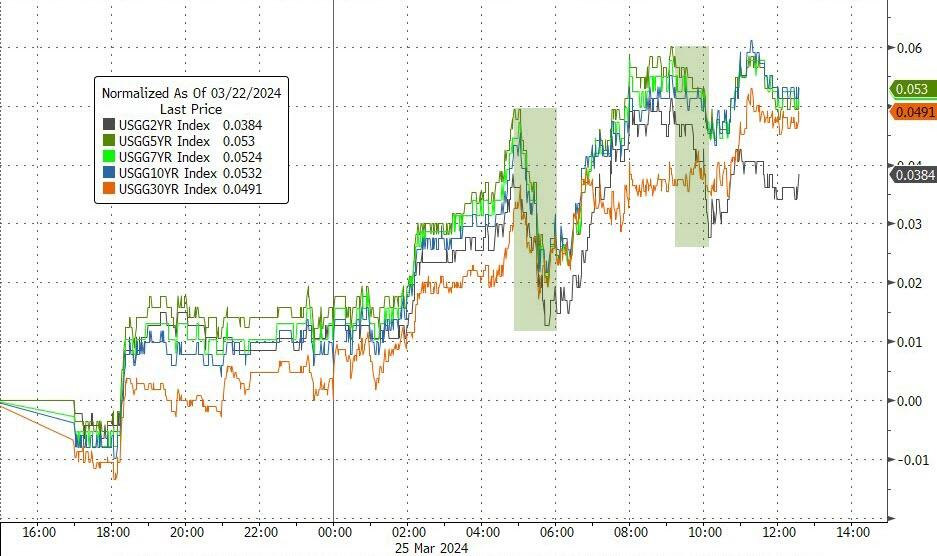
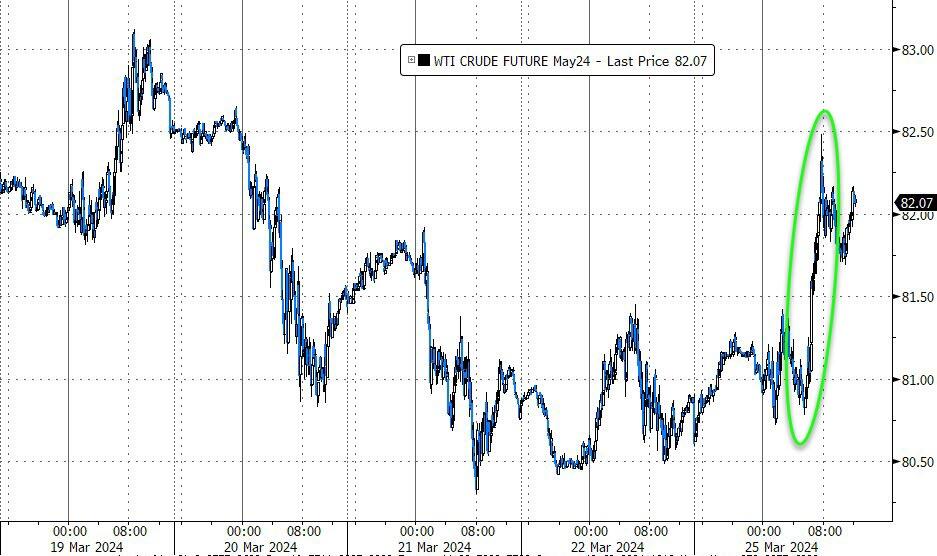
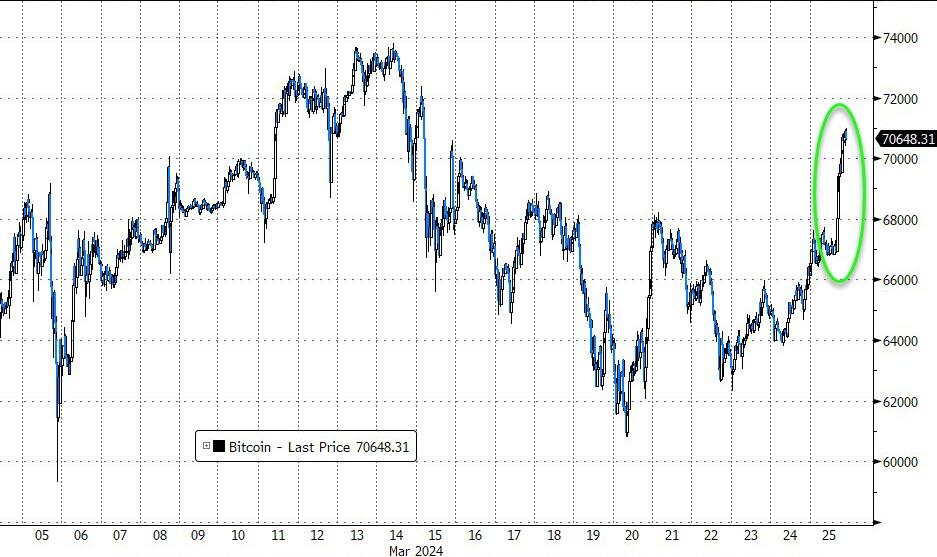
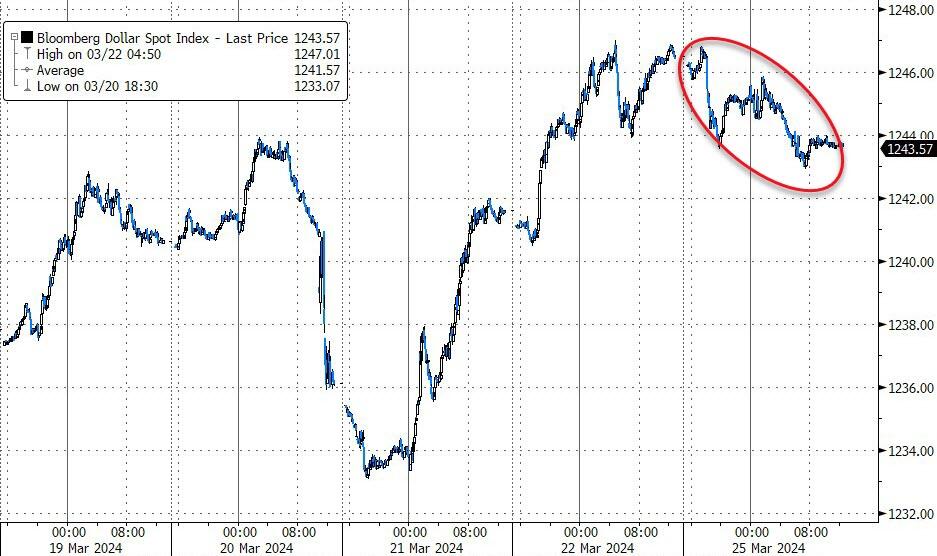
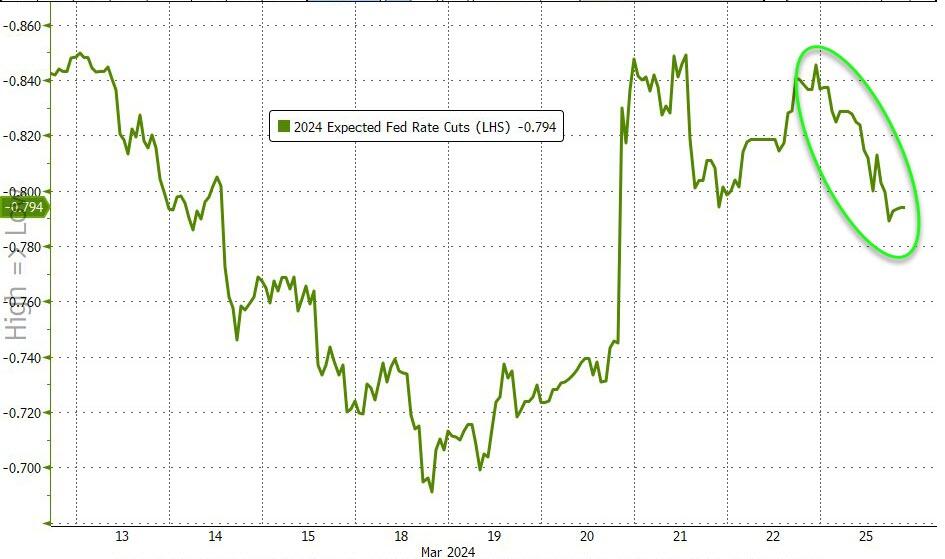
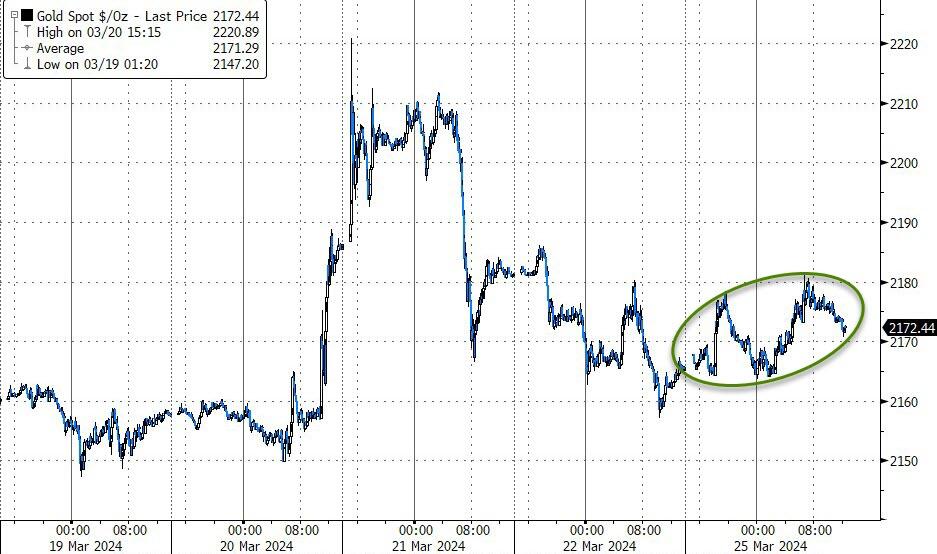
On a day marked by disappointing housing and manufacturing data, bond yields and oil prices rose, but Bitcoin dominated the news cycle with a surge above $71,000, partly driven by short sellers covering their positions. The weaker dollar, influenced by a shift in rate-cut expectations, also favored gold prices.
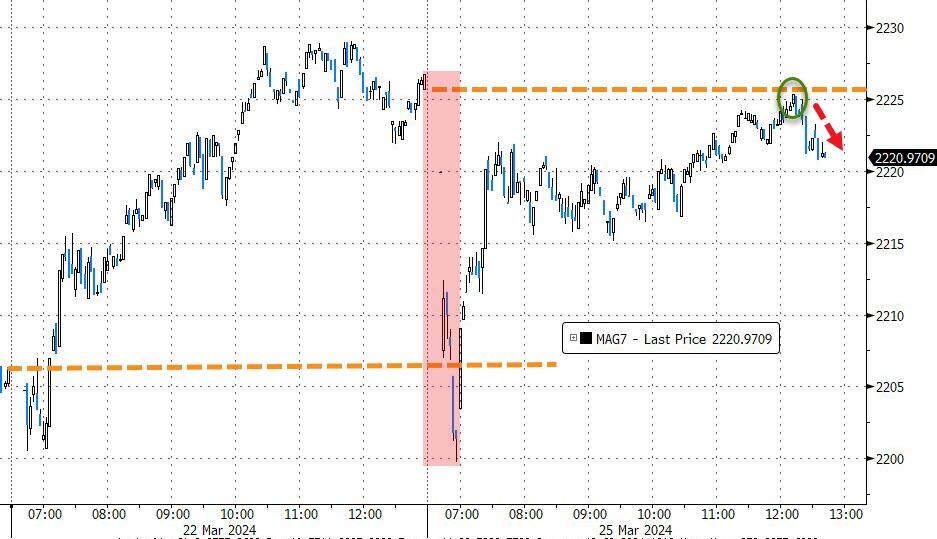
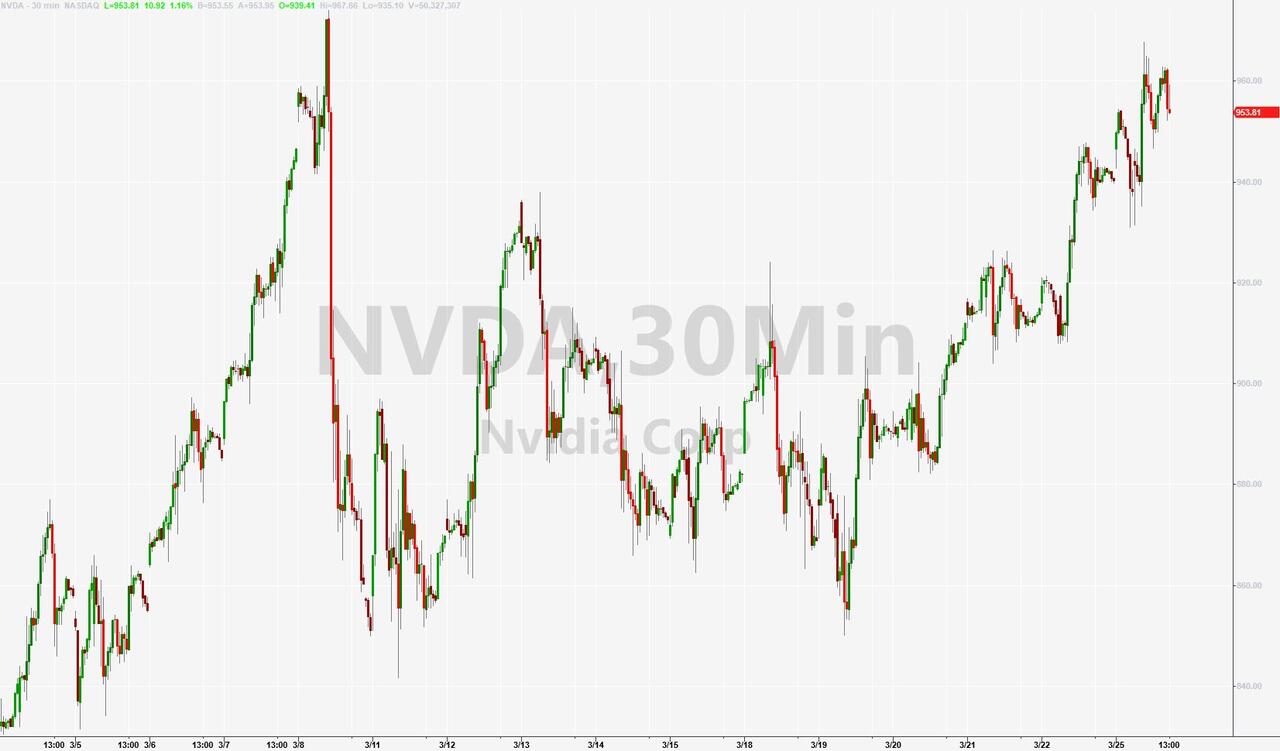
Amidst geopolitical tensions in the Middle East and Russia, bond yields increased, and crude oil prices surged. The MAG 7 stocks recovered from an early plunge, and while Nvidia enjoyed a rally, it failed to surpass its March peak.
With time remaining in this abbreviated trading week, I wonder: What will the next market move be?
2. Current “Buy” Cycles (effective 11/21/2023)
Our Trend Tracking Indexes (TTIs) have both crossed their trend lines with enough strength to trigger new “Buy” signals. That means, Tuesday, 11/21/2023, was the official date for these signals.
If you want to follow our strategy, you should first decide how much you want to invest based on your risk tolerance (percentage of allocation). Then, you should check my Thursday StatSheet and Saturday’s “ETFs on the Cutline” report for suitable ETFs to buy.
3. Trend Tracking Indexes (TTIs)
During this subdued trading session, the major stock indexes failed to recover from their initial downturn. Lackluster housing and manufacturing data capped any potential gains.
In line with this stagnant movement, our TTIs experienced a slight decrease.
This is how we closed 3/25/2024:
Domestic TTI: +10.61% above its M/A (prior close +10.85%)—Buy signal effective 11/21/2023.
International TTI: +10.28% above its M/A (prior close +10.37%)—Buy signal effective 11/21/2023.
All linked charts above are courtesy of Bloomberg via ZeroHedge.
———————————————————-
WOULD YOU LIKE TO HAVE YOUR INVESTMENTS PROFESSIONALLY MANAGED?
Do you have the time to follow our investment plans yourself? If you are a busy professional who would like to have his portfolio managed using our methodology, please contact me directly to get more details.
—————————————————————-
Contact Ulli