

- Moving the markets
The major indexes had a bumpy ride on Thursday, as they plunged after the opening bell, then bounced back, and ended the day flat.
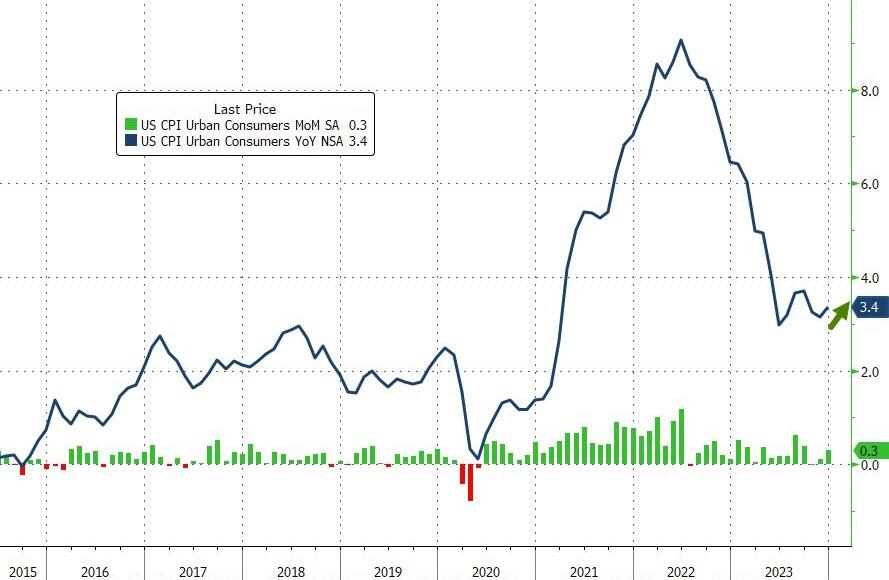
The trigger for the initial sell-off was the latest inflation report, which showed that consumer prices rose more than expected in December, reaching the highest annual rate in 13 years.
The CPI report revealed a 0.3% increase in consumer prices for the month, pushing the annual rate to 3.4%. Economists had forecasted a 0.2% increase in December and a 3.2% annual rate.
The core CPI, which excludes food and energy prices, matched expectations, but still indicated that inflation pressures were persistent, though easing. The report also showed that a key measure of inflation, the core CPI services ex-shelter (or supercore), rose 0.4% month-over-month and 4.09% year-over-year.
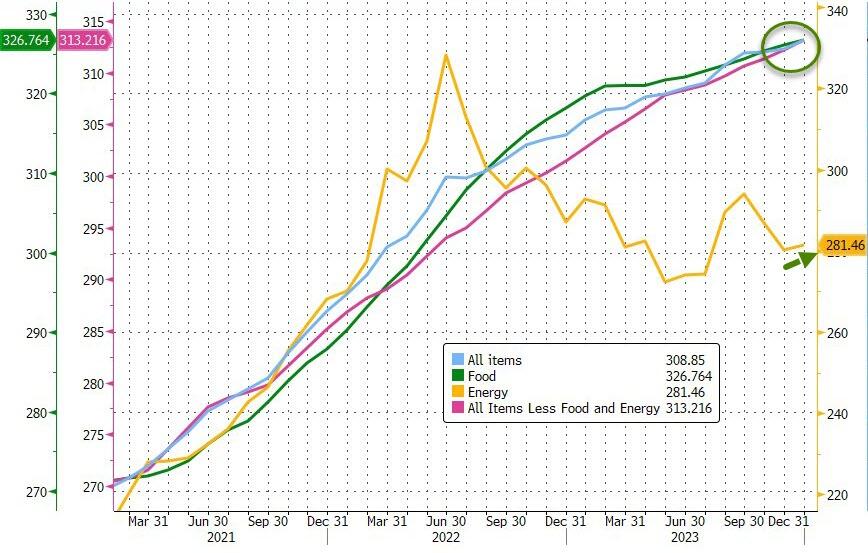
ZeroHedge summarized the report with these bullet points:
• Headline costs at record highs
• Core costs at record highs
• Food costs at record highs
• Fuel costs on the rise again
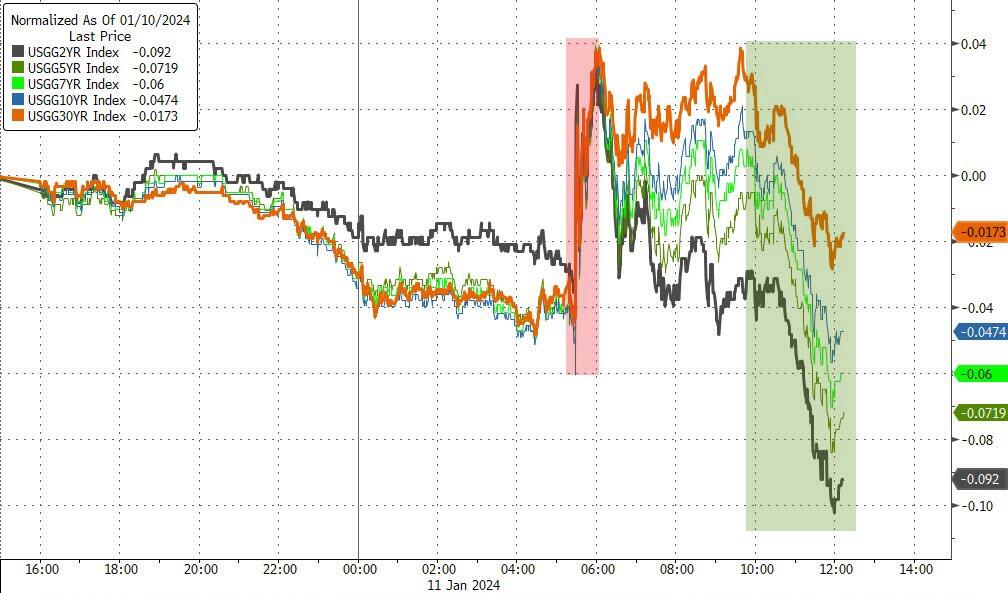
Bond yields and the markets shrugged off the inflation data, and traders kept hoping for a slowdown in price increases this year, despite the evidence to the contrary.
The report also suggested that the Fed may be less inclined to cut interest rates further, or even tighten its monetary policy, to curb inflation.
This could create more volatility in the markets, as the economic recovery remains uncertain, and the macro-economic data remains murky.
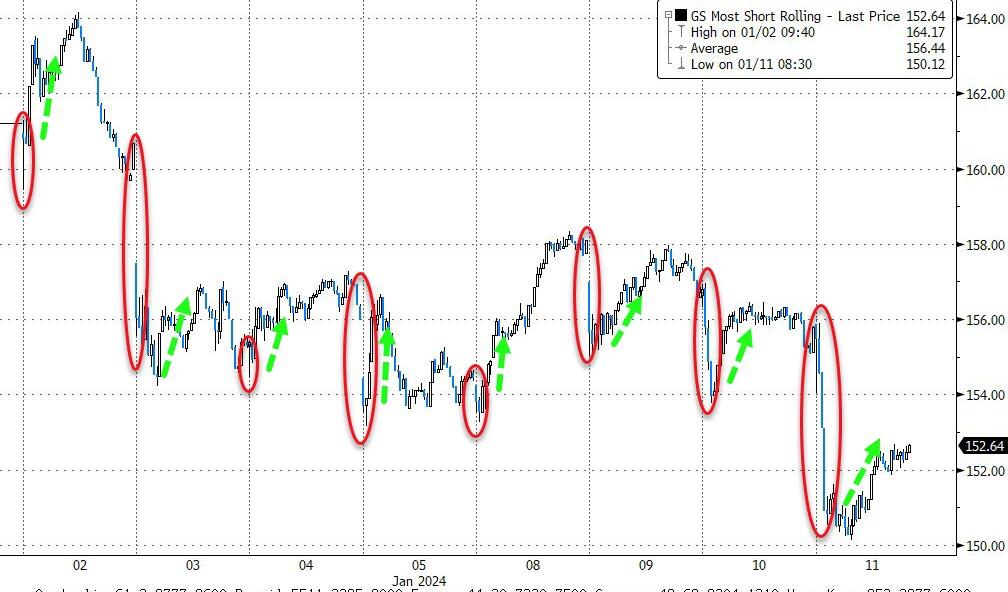
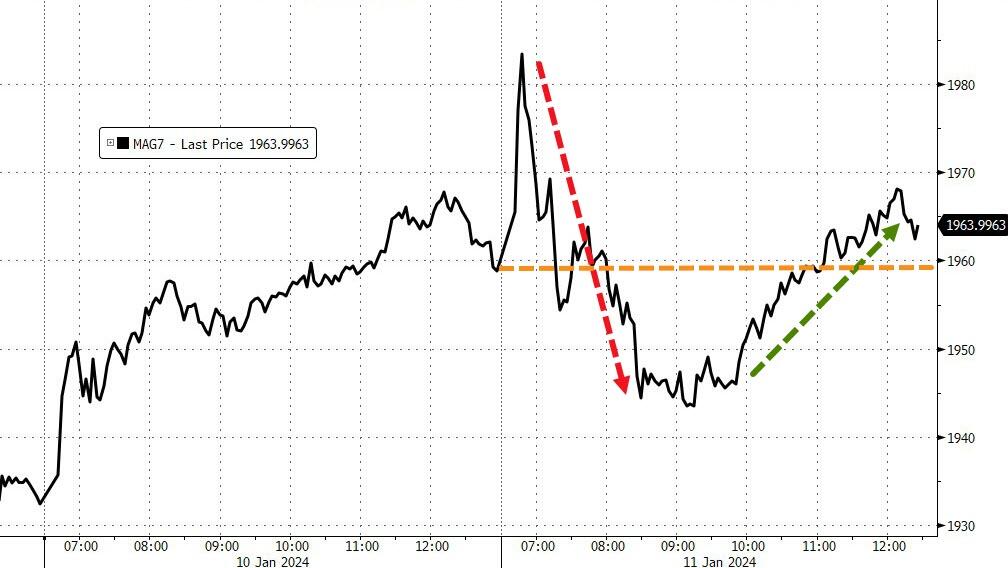
The most shorted stocks dropped today, while the late-session rally did not damage the downtrend. The MAG7 stocks had a wild ride and finished the day unchanged.
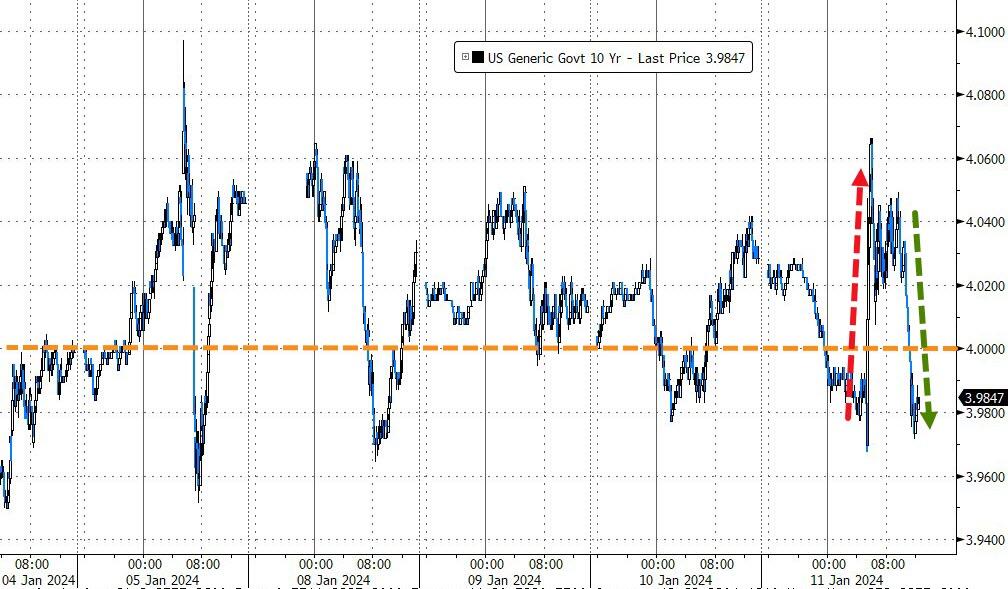
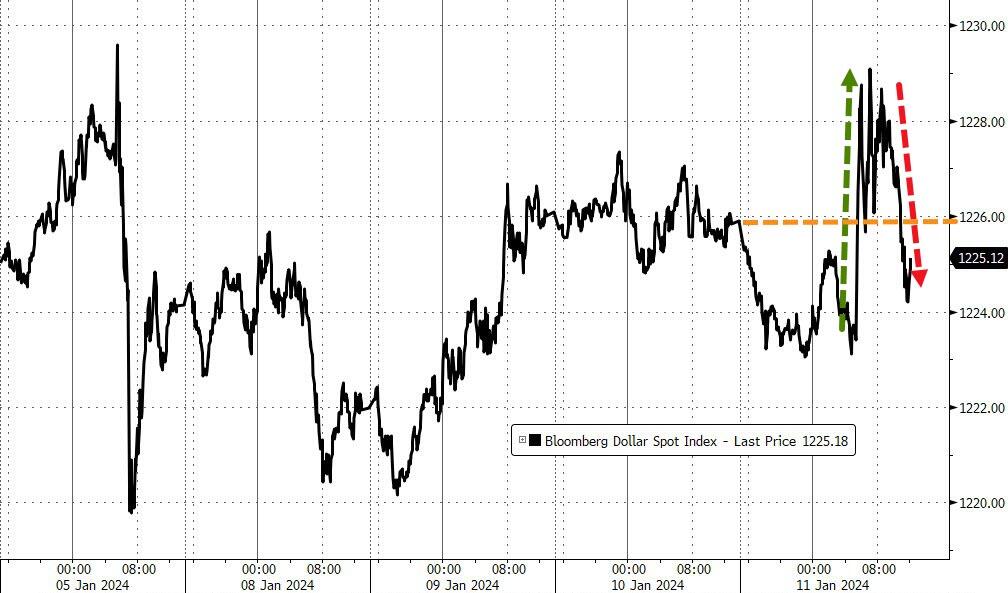
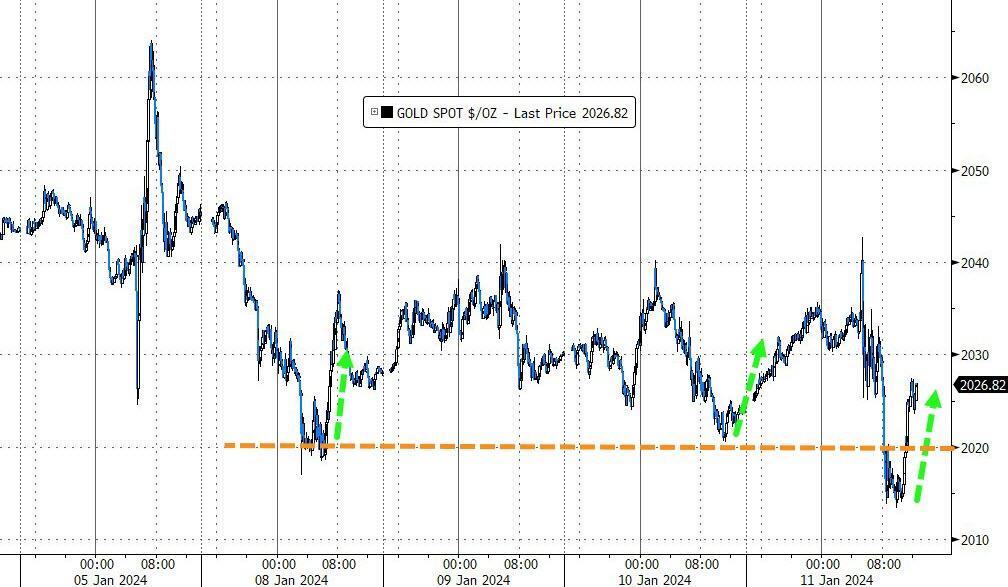
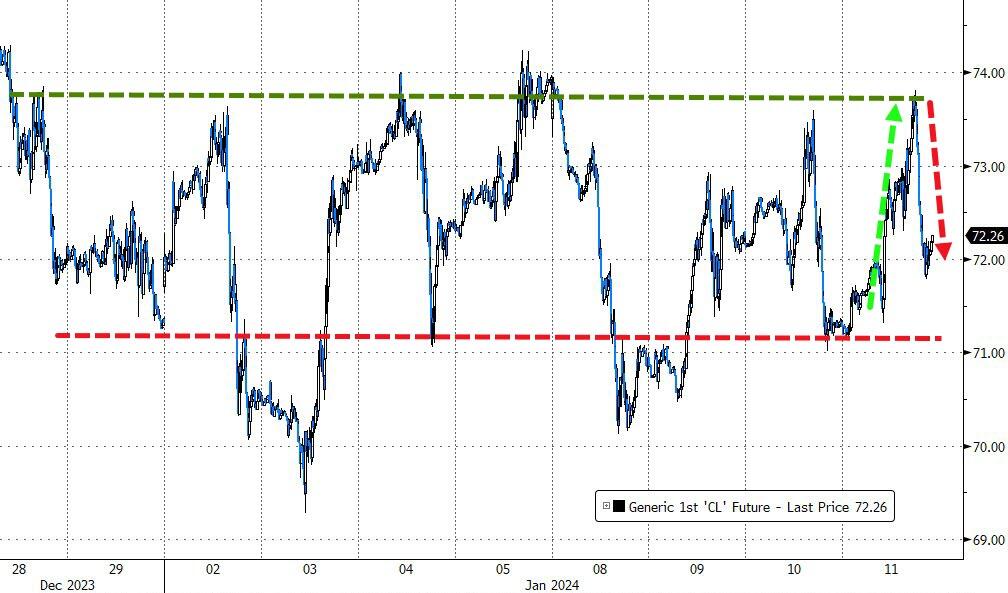
Bond yields spiked at first but fell later in the day, helping stocks erase their losses. The 10-year yield hovered around 4% and closed below it. The dollar fluctuated and weakened in the end. Gold and crude oil faced some volatility as well but managed to end the day slightly higher.
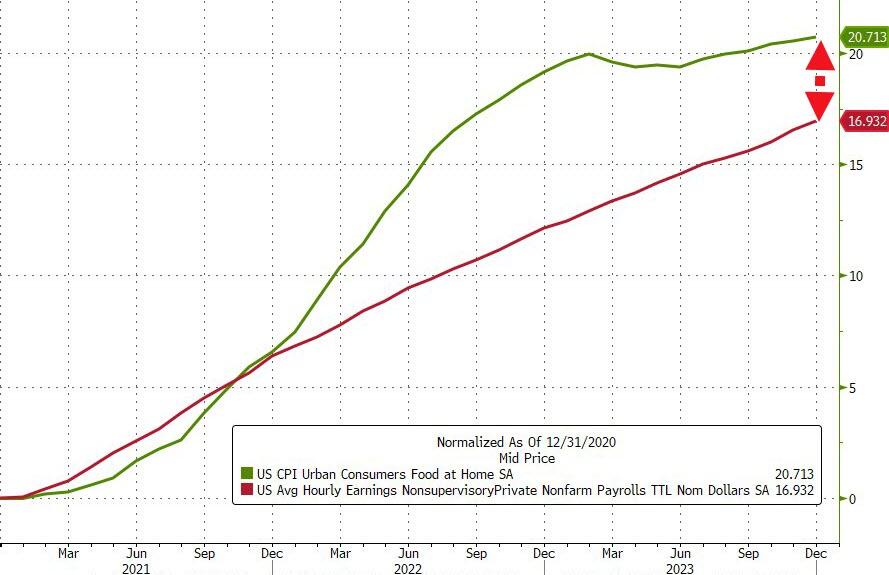
Wall Street tried to make the CPI report look better than it was, but the reality is that things, especially food, are getting more expensive. And sadly, wages are not keeping up, as this chart shows.
Will the markets continue to ignore inflation, or will they wake up and smell the coffee?
Continue reading…
4. Current “Buy” Cycles (effective 11/21/2023)
Our Trend Tracking Indexes (TTIs) have both crossed their trend lines with enough strength to trigger new “Buy” signals. That means, Tuesday, 11/21/2023, was the official date for these signals.
If you want to follow our strategy, you should first decide how much you want to invest based on your risk tolerance (percentage of allocation). Then, you should check my Thursday StatSheet and Saturday’s “ETFs on the Cutline” report for suitable ETFs to buy.
3. Trend Tracking Indexes (TTIs)
The major indexes showed no clear direction after the CPI report revealed higher than expected inflation. The market recovered from an initial drop and ended the day with little change.
Our TTIs declined a bit, but they still indicate a positive outlook for the market.
This is how we closed 1/11/2024:
Domestic TTI: +7.31% above its M/A (prior close +7.62%)—Buy signal effective 11/21/2023.
International TTI: +6.46% above its M/A (prior close +6.62%)—Buy signal effective 11/21/2023.
All linked charts above are courtesy of Bloomberg via ZeroHedge.
———————————————————-
WOULD YOU LIKE TO HAVE YOUR INVESTMENTS PROFESSIONALLY MANAGED?
Do you have the time to follow our investment plans yourself? If you are a busy professional who would like to have his portfolio managed using our methodology, please contact me directly to get more details.
—————————————————————-
Contact Ulli