
ETF Tracker StatSheet
You can view the latest version here.
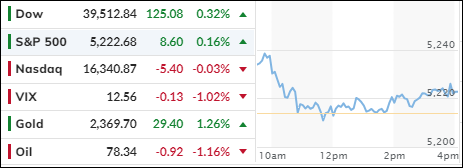
DOW AND S&P 500 RISE AMIDST ECONOMIC UNCERTAINTY AND INFLATION WOES
- Moving the markets
In the intricate dance of the stock market, this week presented a mixed tableau. The Dow and the S&P 500, like seasoned performers, managed to spin around to another session of gains amidst a backdrop of economic uncertainty. This performance, however, was not without its counterpoints.
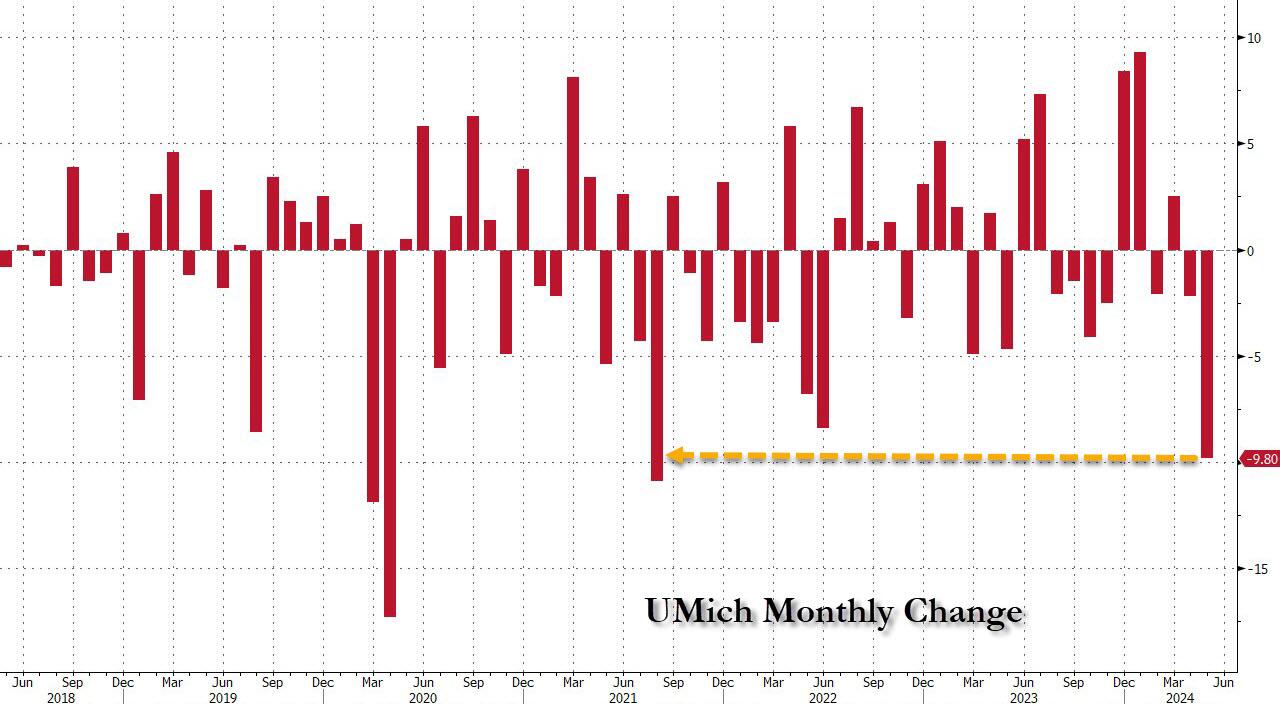
The market’s rhythm was disrupted by the latest consumer sentiment data, which plummeted unexpectedly, signaling a surge in inflation expectations. The University of Michigan’s preliminary consumer sentiment index for May dropped to 67.4, a stark contrast to the Dow Jones estimates of 76 and the lowest in half a year. This data painted a grim picture, suggesting that public perception of the economy is deteriorating, with inflation worries at the forefront of collective concern.
This sentiment has implications for the Federal Reserve’s monetary policy. The central bank’s decisions on interest rates will likely be swayed by the degree of slowdown observed in consumer spending and employment. Yet, if these indicators do not plummet precipitously, it may provide just enough positive sentiment to buoy the markets, which are keenly anticipating rate cuts.
In a recent twist, traders have adopted a more optimistic outlook after signals from the Federal Reserve suggested that an interest rate hike is off the table for the next move. This has led to speculation that interest rates may have reached their peak, a scenario that could prove advantageous for equities.
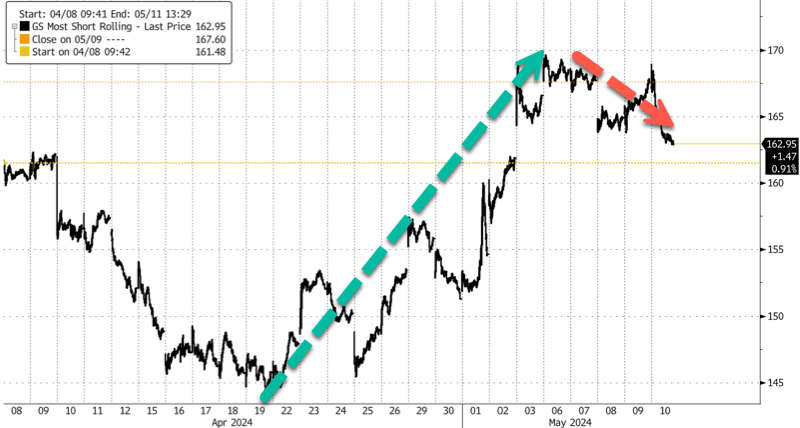
However, the week concluded with a loss of momentum for the most heavily shorted stocks, while bond yields, particularly the closely monitored 10-year yield, climbed past the 4.5% mark due to persistent inflationary pressures. This renewed the focus on the possibility of a “higher for longer” interest rate environment.
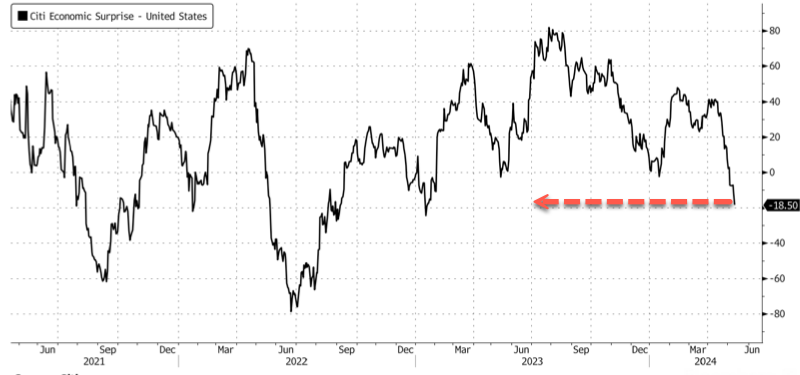
Amidst these developments, the Citi Economic Surprise Index fell to its lowest level since January 2023, hinting at economic fragility. This combination of weak or nonexistent economic growth coupled with inflation resurrects the specter of “Stagflation.”
The repercussions were felt across various assets, with Bitcoin and crude oil prices declining, while the dollar experienced an upswing. With a critical week ahead, featuring key economic data releases such as the Consumer Price Index (CPI), Producer Price Index (PPI), retail sales, and industrial production, the market stands at a crossroads.
As we anticipate these significant data points, one can’t help but wonder:
Will any of these upcoming revelations prove to be a catalyst for market optimism?
2. Current “Buy” Cycles (effective 11/21/2023)
Our Trend Tracking Indexes (TTIs) have both crossed their trend lines with enough strength to trigger new “Buy” signals. That means, Tuesday, 11/21/2023, was the official date for these signals.
If you want to follow our strategy, you should first decide how much you want to invest based on your risk tolerance (percentage of allocation). Then, you should check my Thursday StatSheet and Saturday’s “ETFs on the Cutline” report for suitable ETFs to buy.
3. Trend Tracking Indexes (TTIs)
The financial markets this week were a testament to the delicate interplay between optimism and caution. The week commenced with the major indexes showcasing early gains, signaling a bullish trend that invigorated investor sentiment. This initial surge of enthusiasm, however, was not destined to last.
Amidst these fluctuations, the S&P 500 emerged as a beacon of resilience, securing its third straight weekly gain. This index’s ability to withstand the market’s ebb and flow is indicative of underlying strengths, such as robust corporate earnings and strategic sector investments, which bolster investor confidence.
Our TTIs also reflected the week’s complex narrative. While they experienced a slight decline, their overall positive trajectory remained intact.
This is how we closed 5/10/2024:
Domestic TTI: +8.63% above its M/A (prior close +8.76%)—Buy signal effective 11/21/2023.
International TTI: +9.36% above its M/A (prior close +9.37%)—Buy signal effective 11/21/2023.
All linked charts above are courtesy of Bloomberg via ZeroHedge.
———————————————————-
WOULD YOU LIKE TO HAVE YOUR INVESTMENTS PROFESSIONALLY MANAGED?
Do you have the time to follow our investment plans yourself? If you are a busy professional who would like to have his portfolio managed using our methodology, please contact me directly to get more details.
—————————————————————-
Contact Ulli