
- Moving the markets
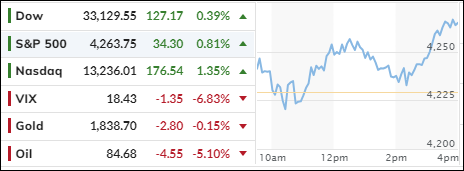
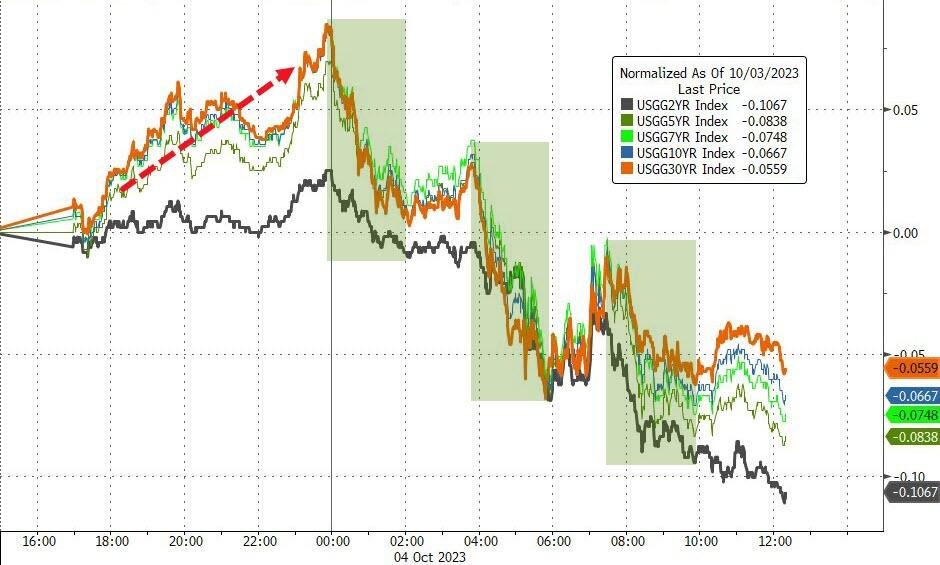
The S&P 500 had a rare, good day on Wednesday, as investors breathed a sigh of relief when Treasury yields retreated from their highest levels since 2007.
The catalyst was a disappointing jobs report that showed the labor market was not as hot as expected. But don’t get too excited because this could be just a temporary bounce in a downtrend.
The market is still under pressure from rising interest rates, slowing economic growth, and geopolitical risks. Unless rates come down without triggering a financial meltdown or a recession, the bulls will have a hard time finding buyers.
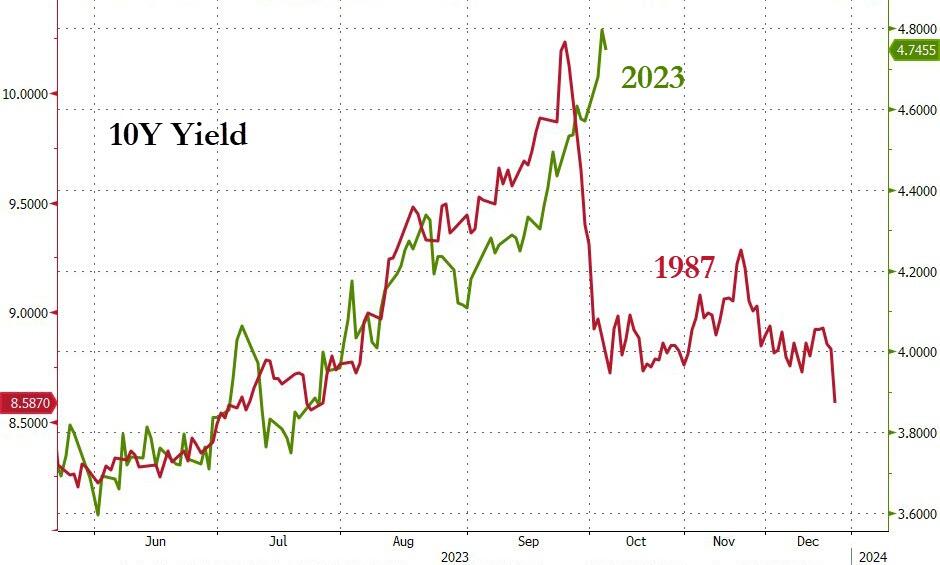
The jobs report revealed that only 89,000 private payrolls were added in September, far below the forecast of 160,000 and the revised 180,000 in August. This sent the 10-year Treasury yield down to 4.732%, after it had crossed the 4.8% threshold on Tuesday.
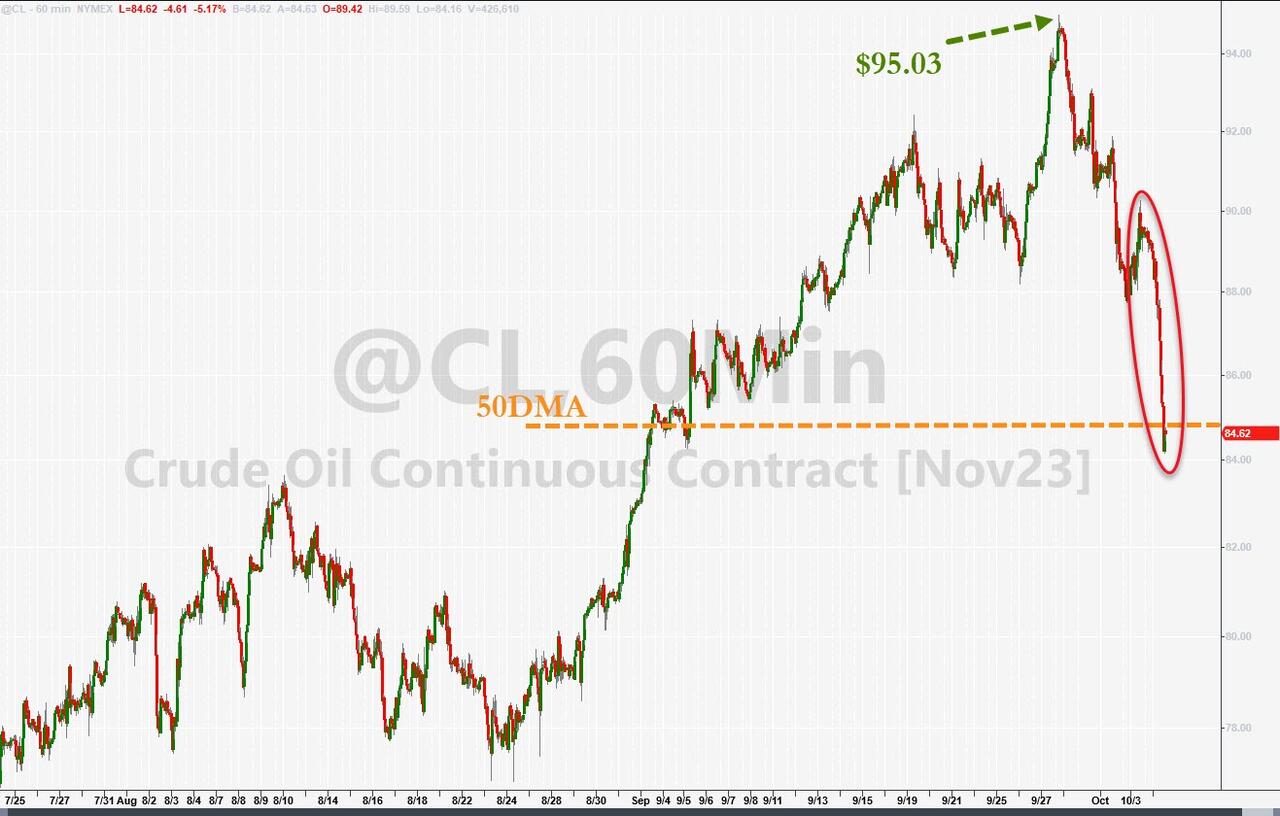
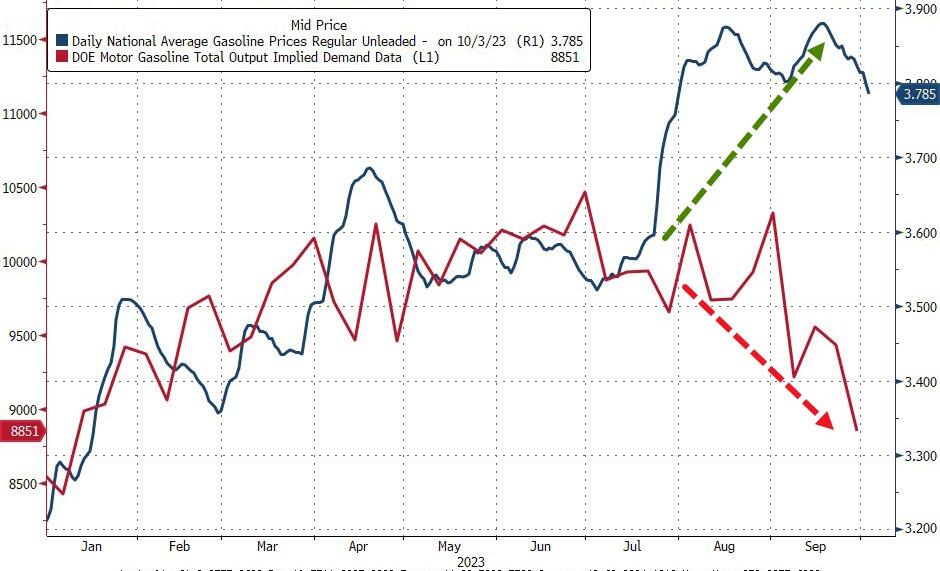
The consumer discretionary sector was the star of the day, gaining more than 1%. The energy sector was the loser, as oil prices dropped below $85 per barrel. The high gas prices seem to have taken a toll on consumer spending, as gasoline demand plunged to its lowest level for this time of year since 1997.
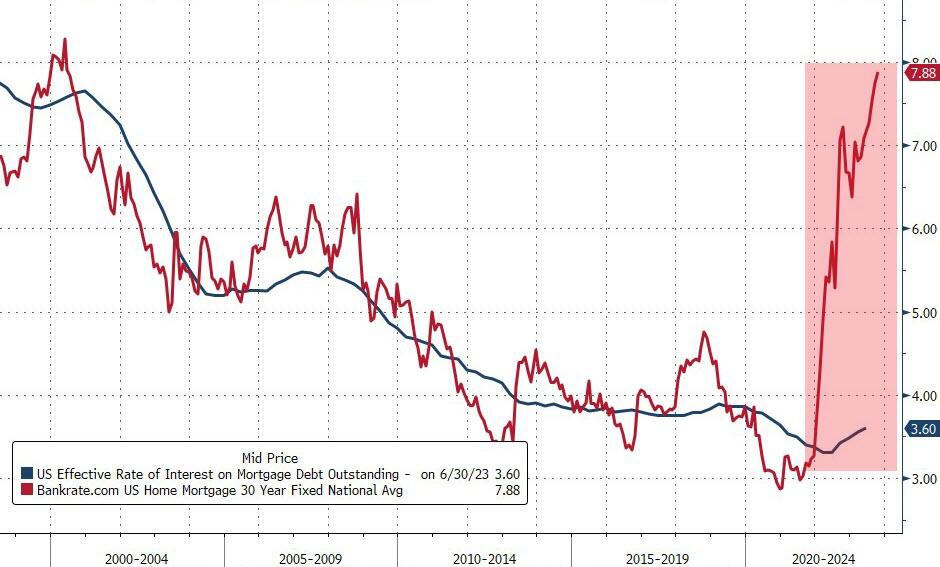
Higher interest rates have also hurt the housing market, as mortgage rates climbed near 8%. As a result, mortgage demand fell to its lowest level since 1996. That’s gotta hurt!
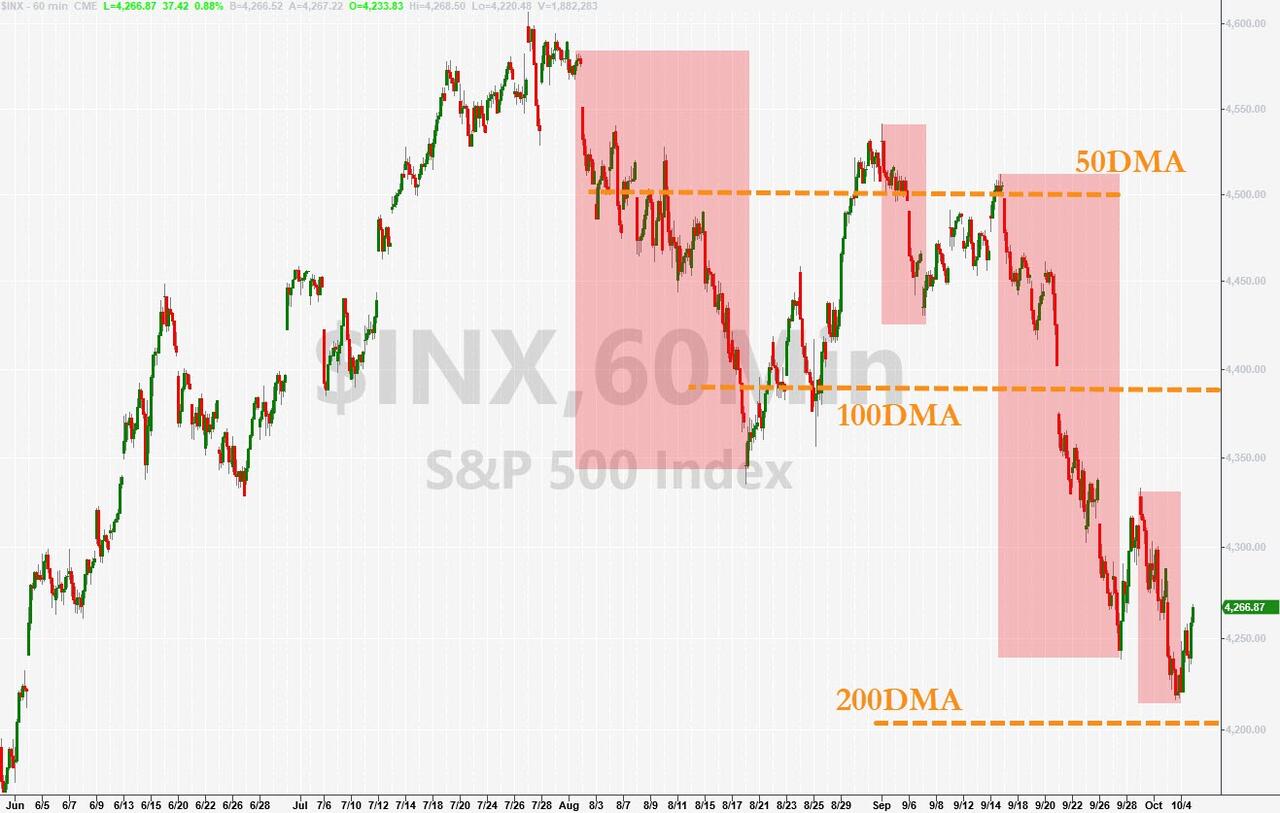
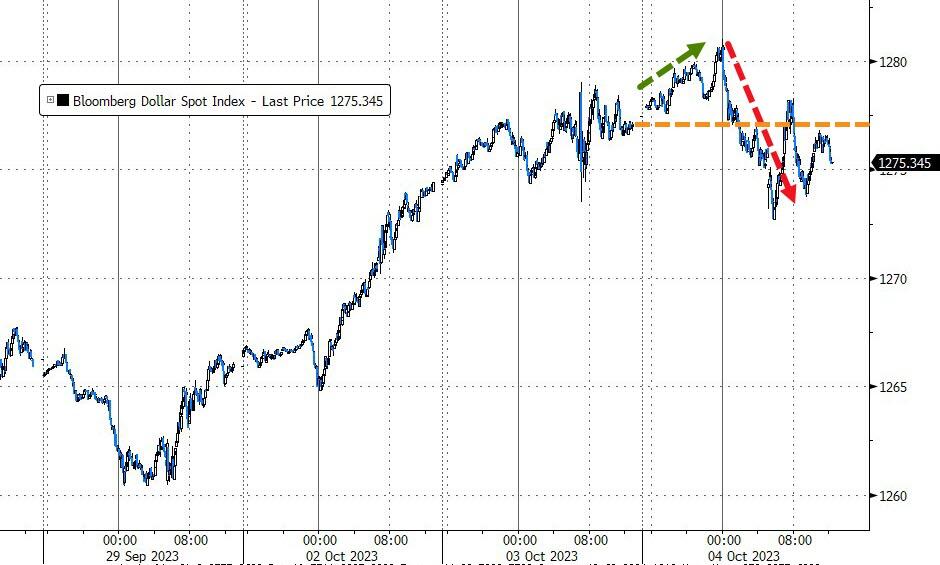
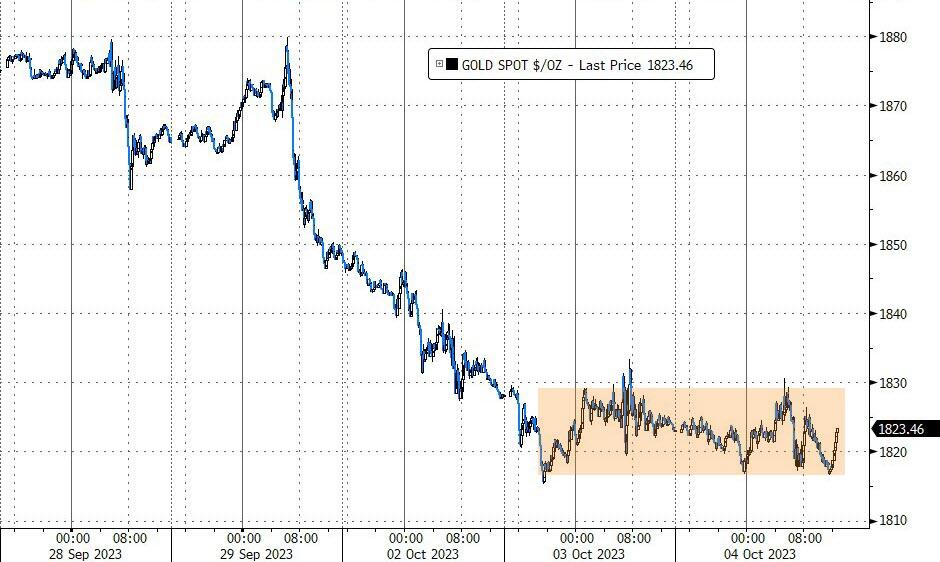
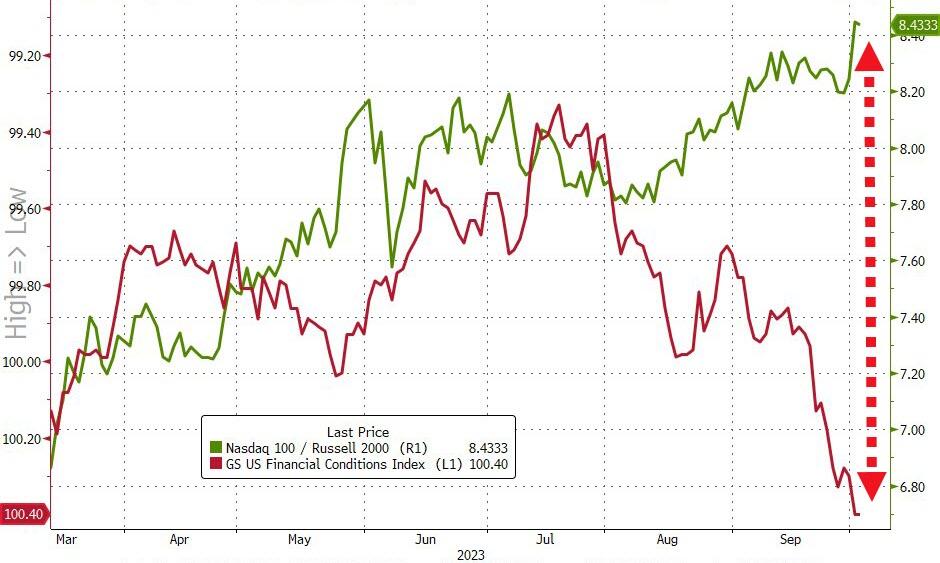
The S&P 500 has been making lower lows on 33 of the past 50 trading days, the dollar has barely moved, gold has been flat, and financial conditions have been tight.
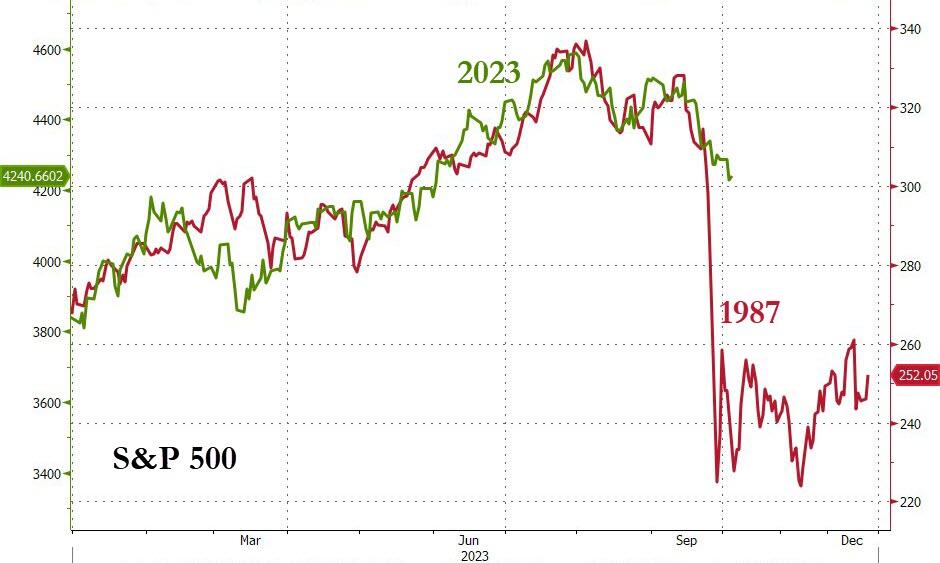
Some analysts have compared the current situation to historical events, such as the ZeroHedge charts that show the similarity between the S&P 500 and the 10-year yield now and in 1987.
Is history repeating itself or rhyming?
2. “Buy” Cycle (12/1/22 to 9/21/2023)
The current Domestic Buy cycle began on December 1, 2022, and concluded on September 21, 2023, at which time we liquidated our holdings in “broadly diversified domestic ETFs and mutual funds”.
Our International TTI has now dipped firmly below its long-term trend line, thereby signaling the end of its current Buy cycle effective 10/3/23.
We have kept some selected sector funds. To make informed investment decisions based on your risk tolerance, you can refer to my Thursday StatSheet and Saturday’s “ETFs on the Cutline” report.
Considering the current turbulent times, it is prudent for conservative investors to remain in money market funds—not bond funds—on the sidelines.
3. Trend Tracking Indexes (TTIs)
The market saw a recovery after weeks of heavy losses, as some investors took advantage of lower prices. However, this does not mean that the overall trend has reversed.
Our Trend Tracking Indexes (TTIs) showed a mixed picture, with the Domestic TTI rising slightly and the International TTI falling further below its trend line.
This is how we closed 10/4/2023:
Domestic TTI: -4.32% below its M/A (prior close –4.86%)—Sell signal effective 9/22/2023.
International TTI: -2.88% below its M/A (prior close -2.66%)—Sell signal effective 10/3/2023.
All linked charts above are courtesy of Bloomberg via ZeroHedge.
Contact Ulli