
- Moving the markets
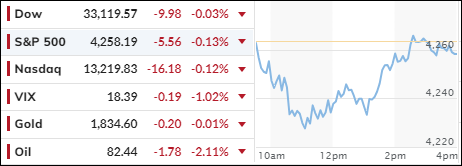
The major indexes tiptoed on Thursday, waiting for the big reveal of the jobs data on Friday that could make or break interest rate policy.
Weekly initial jobless claims were 207,000 for the week ending Sept. 30, a measly 2,000 more than the previous week. Economists had predicted 210,000. The tiny bump in jobless claims was no surprise to the Street, but it dashed the hopes of some investors who wanted to see some signs of a labor market meltdown and a stop to the rising rates that are killing the stocks.
The 10-year Treasury yield jumped a bit after the jobless claims report before crawling back down. It ended the day at 4.713% and stayed flat during the session.
On Friday, economists expect non-farm payrolls for September to show a 170,000 increase, down from a 187,000 boost in August. Investors are not rooting for a recession, but they are crossing their fingers for some labor market slack that would make the Federal Reserve think twice about hiking rates again and put an end to the soaring Treasury yields that hit 16-year highs.
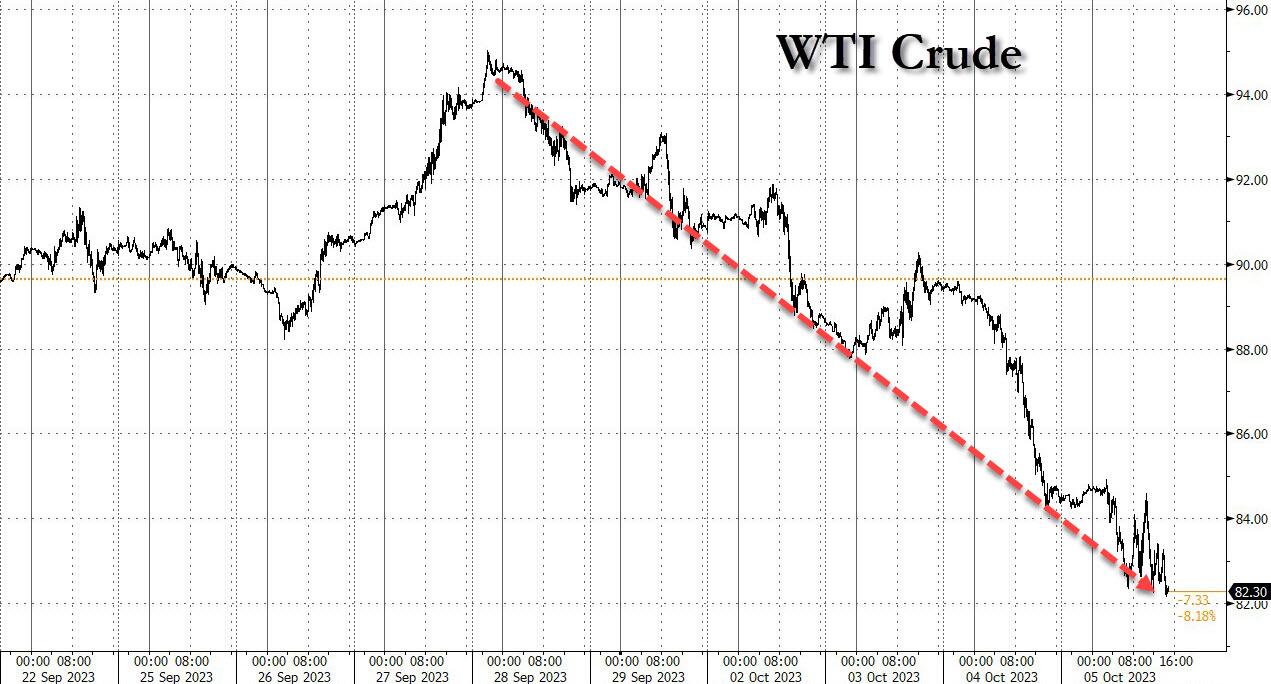
The crude oil moves in the past week have been a circus act, with WTI soaring above $95 last Thursday only to nosedive to $82 today, after tumbling by more than 5% yesterday, the biggest one day drop since last September’s panic attack. There are a few explanations for why oil has tanked so hard, such as weak demand, crowded bets on oil, and geopolitical worries. But who really knows…
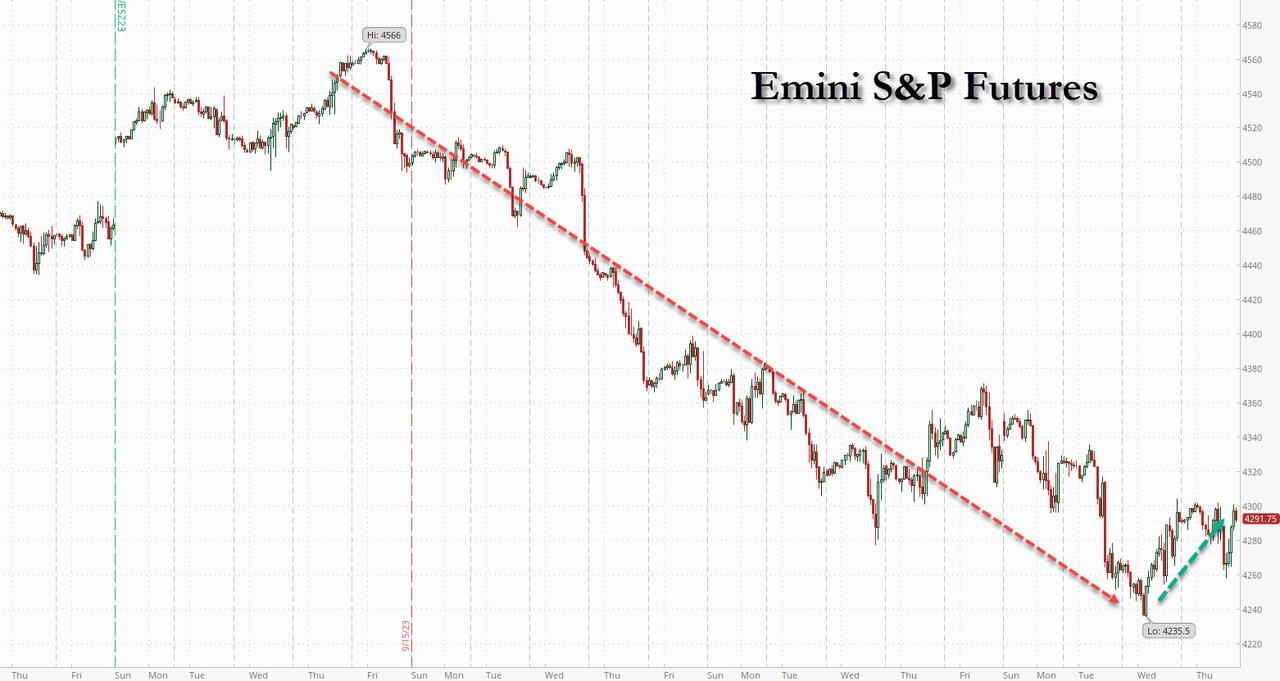
The S&P 500 had a wild ride today, but in the end barely moved from yesterday’s turnaround. Still, the index has some work to do before getting back on track with a bullish trend.
That said, unless we see a huge flop in the jobs report and a plunge tomorrow, it’s hard to imagine how stocks will manage to lift the S&P by 0.7% on Friday and erase what is likely to be another weekly loss for stocks, the fifth in a row, and the longest such streak since May 2022.
Will the payroll report save or sink the market tomorrow? Stay tuned…
Continue reading…
2. “Buy” Cycle (12/1/22 to 9/21/2023)
The current Domestic Buy cycle began on December 1, 2022, and concluded on September 21, 2023, at which time we liquidated our holdings in “broadly diversified domestic ETFs and mutual funds”.
Our International TTI has now dipped firmly below its long-term trend line, thereby signaling the end of its current Buy cycle effective 10/3/23.
We have kept some selected sector funds. To make informed investment decisions based on your risk tolerance, you can refer to my Thursday StatSheet and Saturday’s “ETFs on the Cutline” report.
Considering the current turbulent times, it is prudent for conservative investors to remain in money market funds—not bond funds—on the sidelines.
3. Trend Tracking Indexes (TTIs)
The major indexes fluctuated throughout the day and closed with a slight loss.
Our Trend Tracking Indexes (TTIs) showed mixed results, with the Domestic TTI declining and the International TTI rising slightly. These trends did not change our bearish outlook on the market.
This is how we closed 10/5/2023:
Domestic TTI: -4.59% below its M/A (prior close –4.32%)—Sell signal effective 9/22/2023.
International TTI: -2.54% below its M/A (prior close -2.88%)—Sell signal effective 10/3/2023.
All linked charts above are courtesy of Bloomberg via ZeroHedge.
Contact Ulli