
- Moving the markets
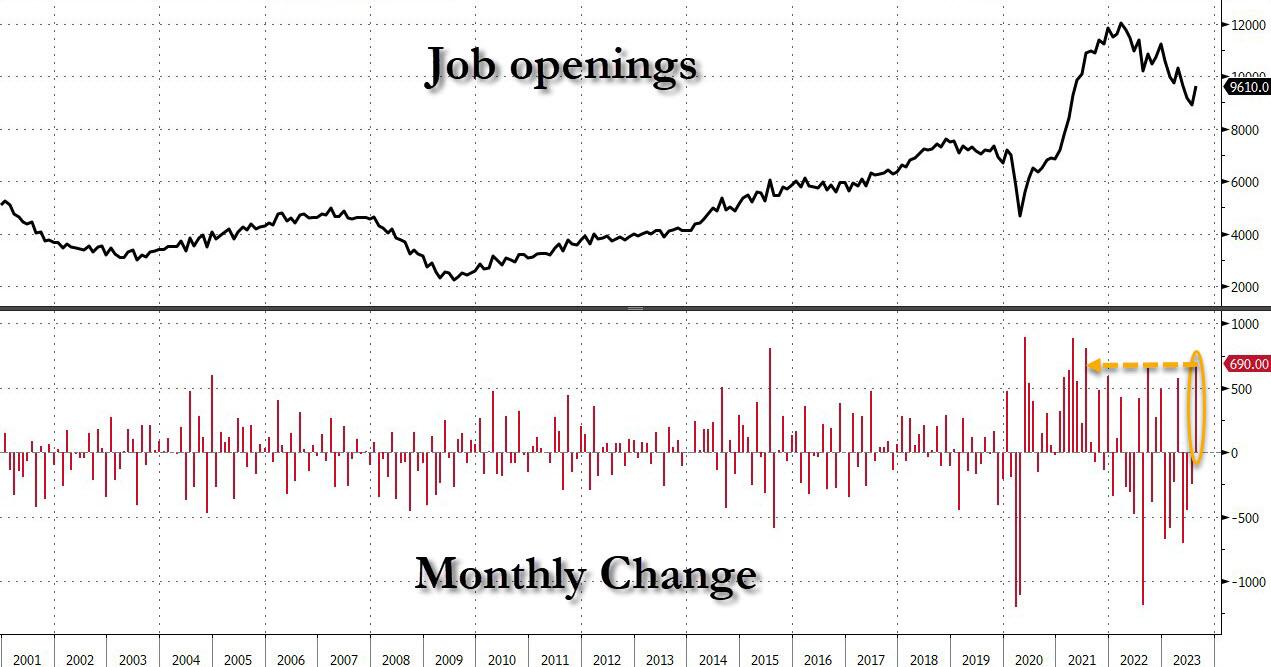
The stock market plunged today as bond yields soared to new highs. The trigger was the August job openings report, which showed a record-breaking 9.61 million vacancies in the U.S. economy. That’s a whopping 690,000 more than the previous month, and the largest jump since July 2020.
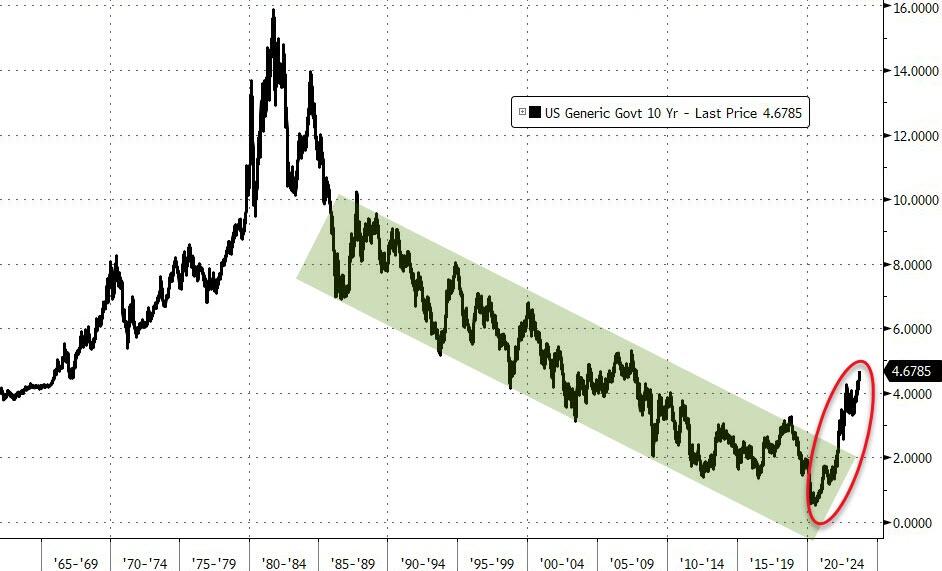
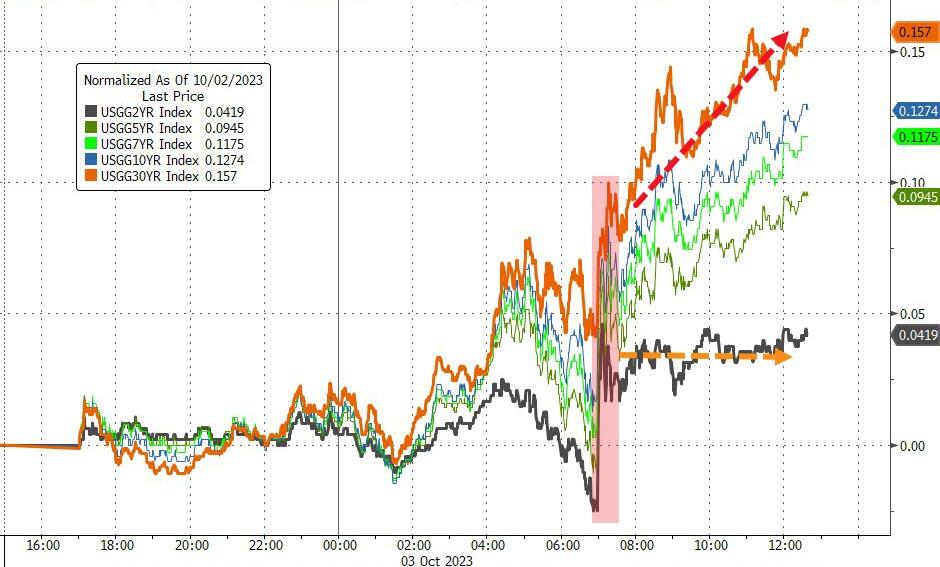
The 10-year Treasury yield settled at 4.80%, slightly below its peak of 4.81% in the morning, which was the highest level since 2007. Investors are finally waking up to the reality that the Fed is and has been serious about tightening monetary policy for a long time. I have been warning about this all year, while the Wall Street pundits were in denial.
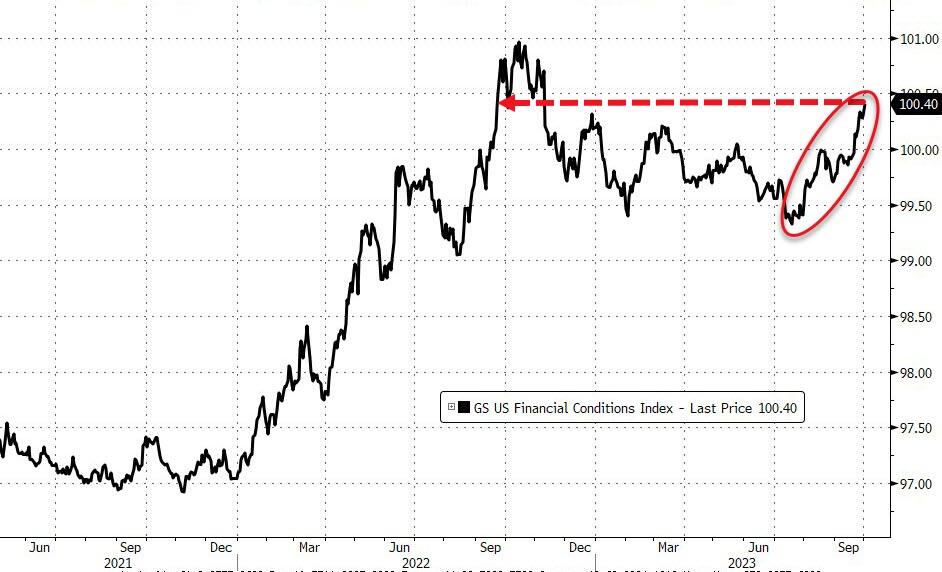
High yields are bad news for stocks, especially as financial conditions get tighter and tighter. CNBC’s Rick Santelli added fuel to the fire by predicting that the 10-year yield could reach 13% or 14% in the next seven years. He blamed the runaway government spending and the looming $2 trillion deficit for triggering inflation and bond vigilantes.
He has a point, but his doom-and-gloom scenario did not go down well with the equity bulls, who sold off their shares in panic. The only silver lining is that we, as Trend Followers, have been out of this mess since our domestic TTI signaled a “Sell” on 9/22/2023.
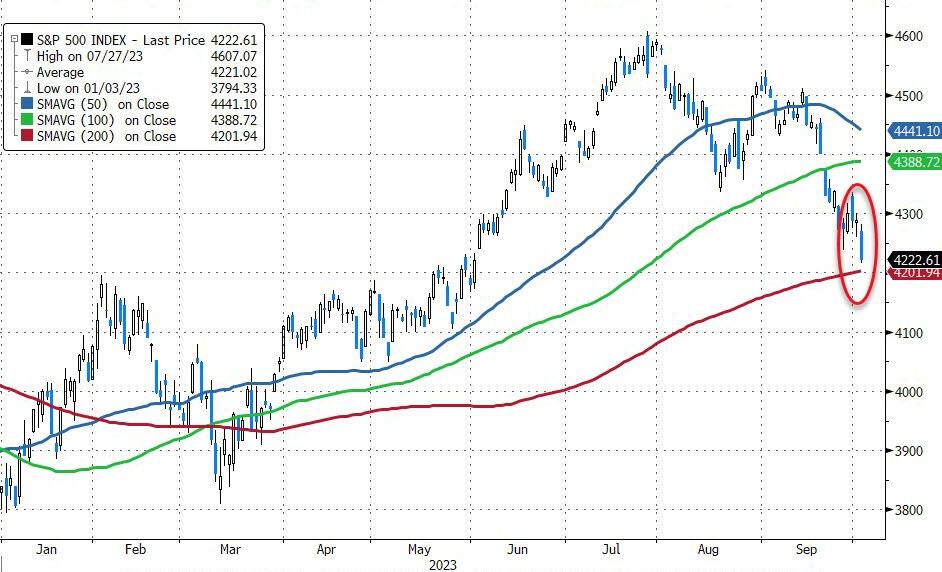
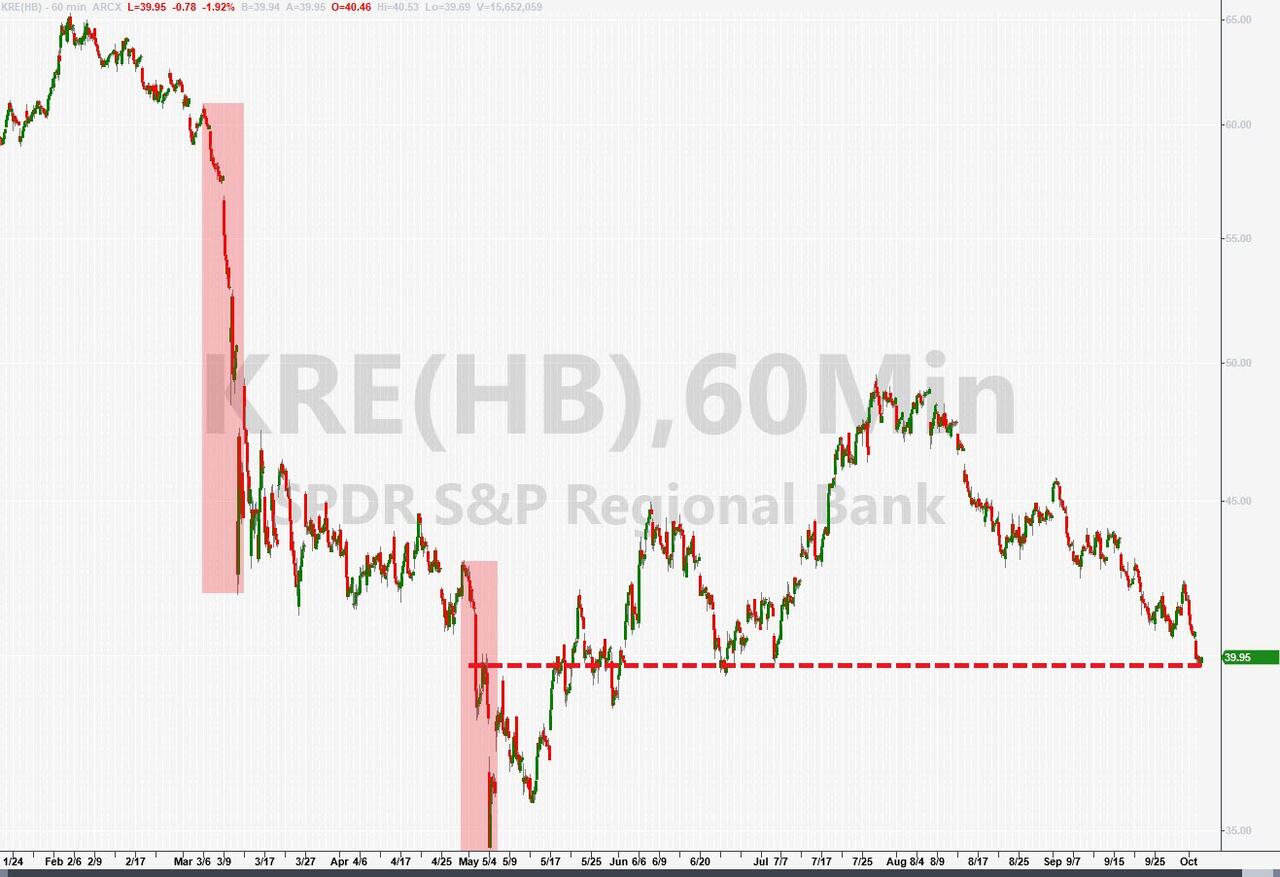
Things could get even uglier if the S&P 500 breaks below its 200-day moving average, which is not far away. Banks (KRE) are also suffering, as higher yields expose their balance sheet problems.
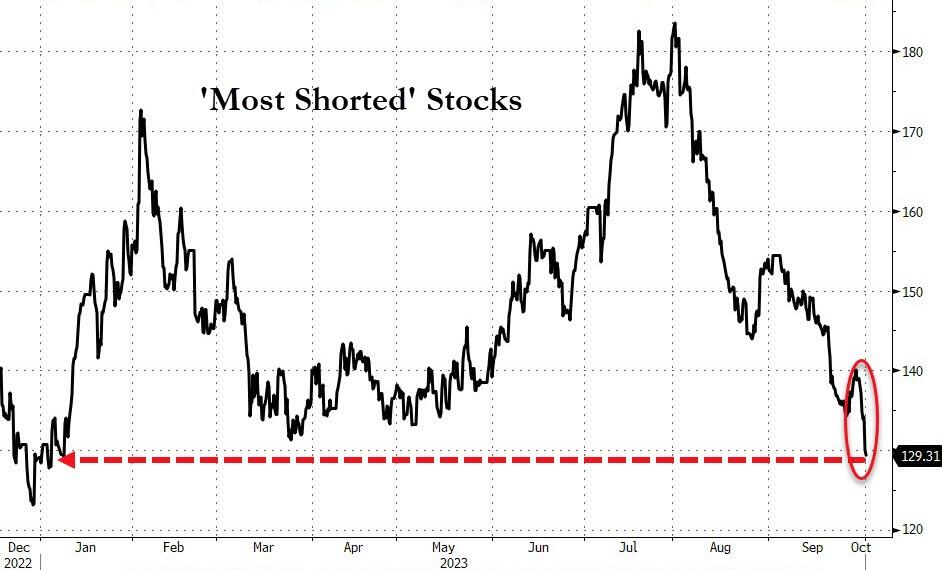
Interestingly, the one thing that used to prop up the market most of the year – short squeezes – is no longer working. The most shorted stocks are now in negative territory for the year.
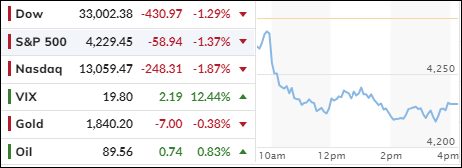
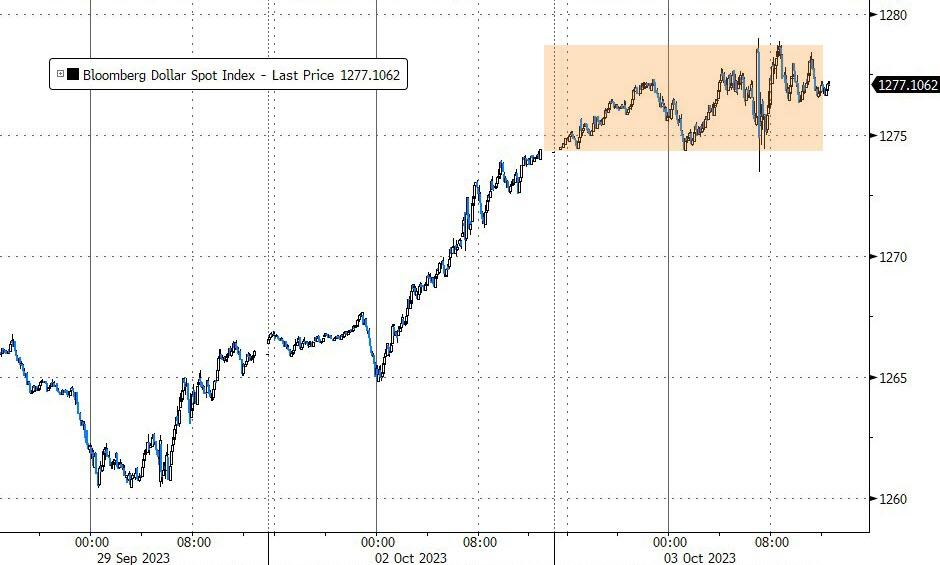
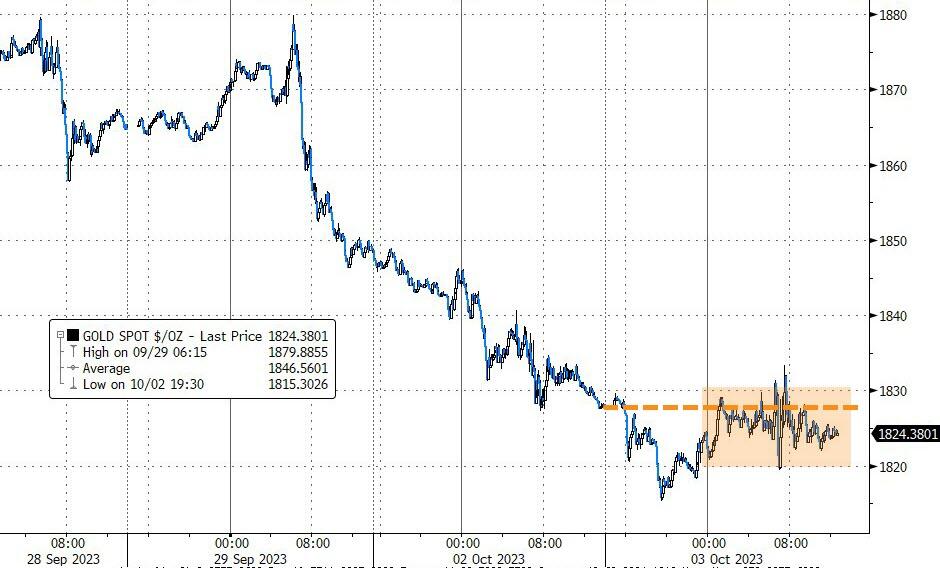
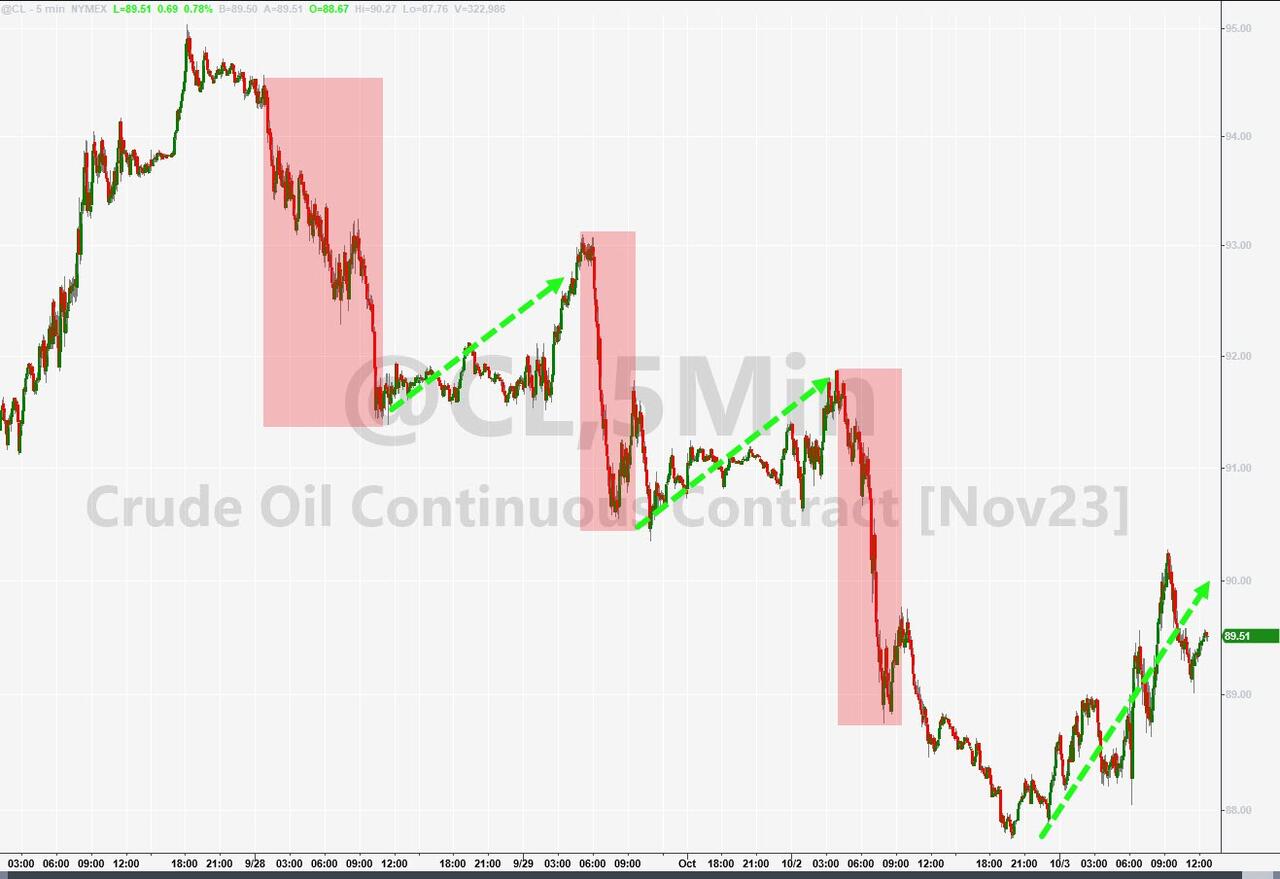
Meanwhile, bond yields surged, the dollar was flat, gold was down a tad, and oil was up.
QTR’s Fringe had a nice take on the current uncertainty:
There is no way that an “everything bubble” inflated by years of zero interest rates and trillions of dollars of global “quantitative easing” can survive when faced with 5%+ rates and $95 billion/month of U.S. “quantitative tightening” plus less money from other central banks.
Contrary to what equity bulls think, bubbles don’t pop softly, and when they do, it takes a long time for lower inflation and lower rates to help stock prices. When the 2000 bubble popped and the Nasdaq crashed by 83% and the S&P 500 by 50%, inflation rates were only 3.4% in 2000, 2.8% in 2001 and 1.6% in 2002, and the Fed was cutting rates almost non-stop.
Will this time be different?
2. “Buy” Cycle (12/1/22 to 9/21/2023)
The current Domestic Buy cycle began on December 1, 2022, and concluded on September 21, 2023, at which time we liquidated our holdings in “broadly diversified domestic ETFs and mutual funds”.
Our International TTI has now dipped firmly below its long-term trend line, thereby signaling the end of its current Buy cycle effective 10/3/23.
We have kept some selected sector funds. To make informed investment decisions based on your risk tolerance, you can refer to my Thursday StatSheet and Saturday’s “ETFs on the Cutline” report.
Considering the current turbulent times, it is prudent for conservative investors to remain in money market funds—not bond funds—on the sidelines.
3. Trend Tracking Indexes (TTIs)
The stock market suffered a heavy blow, as rising bond yields spooked investors and triggered a sell-off.
Our Trend Tracking Indexes (TTIs) both fell sharply and are now firmly below their respective trend lines, indicating a bearish market. If the S&P 500 falls below its 4,200-support level, we could see more losses ahead.
As Trend Followers, we are staying out of this turmoil.
This is how we closed 10/3/2023:
Domestic TTI: -4.86% below its M/A (prior close –3.70%)—Sell signal effective 9/22/2023.
International TTI: -2.66% below its M/A (prior close -1.38%)—Sell signal effective 10/3/2023.
All linked charts above are courtesy of Bloomberg via ZeroHedge.
Contact Ulli