
- Moving the markets
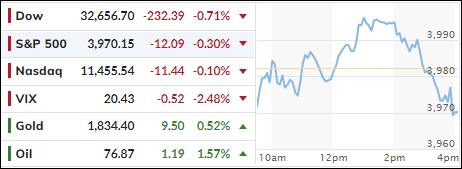
Despite a good midday effort, at which time bullish sentiment exploded to the upside, the bounce turned out to be nothing more than a head fake, with two out of the three major indexes slipping back into the red—not only for the day but for the month as well.
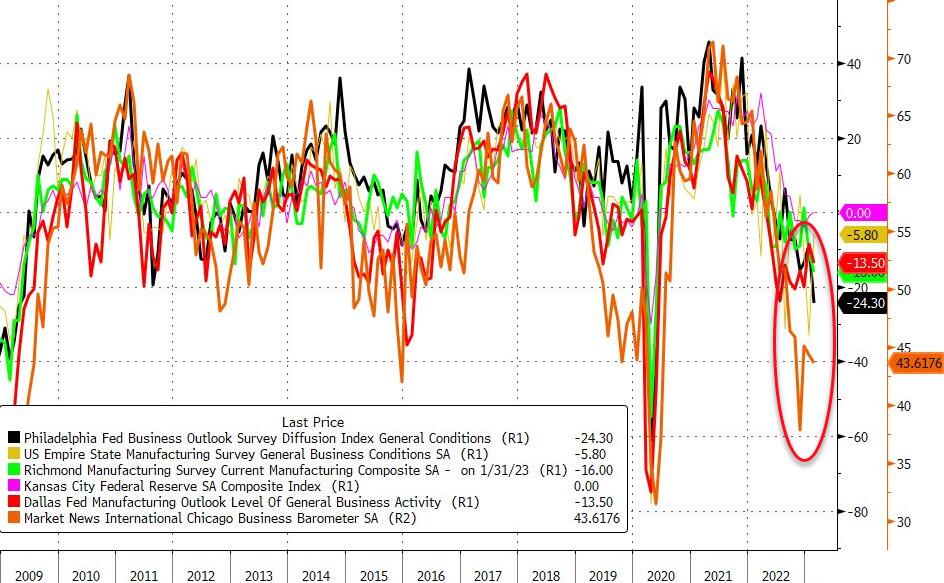
Again, economic data points were negative, with this spaghetti menu of widely followed indicators showing one thing, namely that the direction is “down” with most of them remaining in contraction mode.
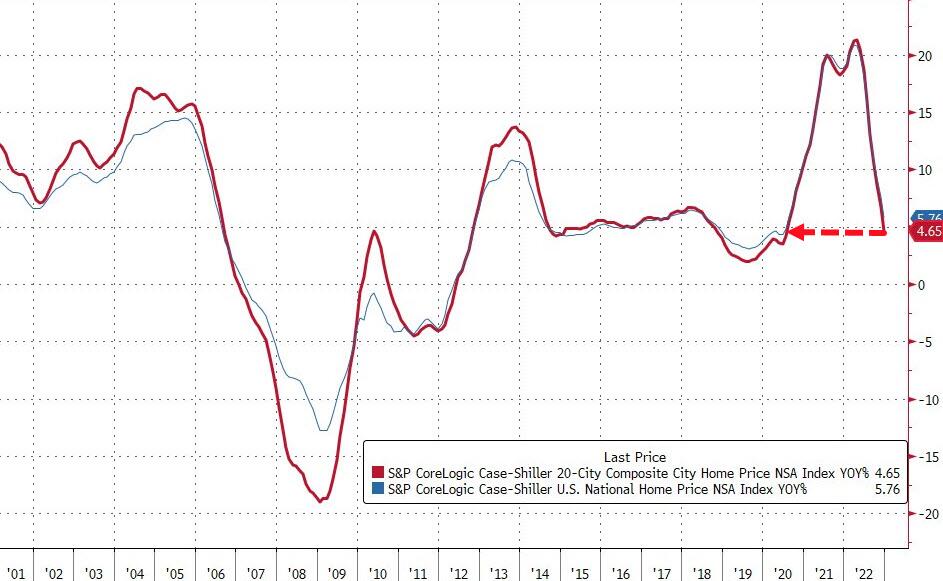
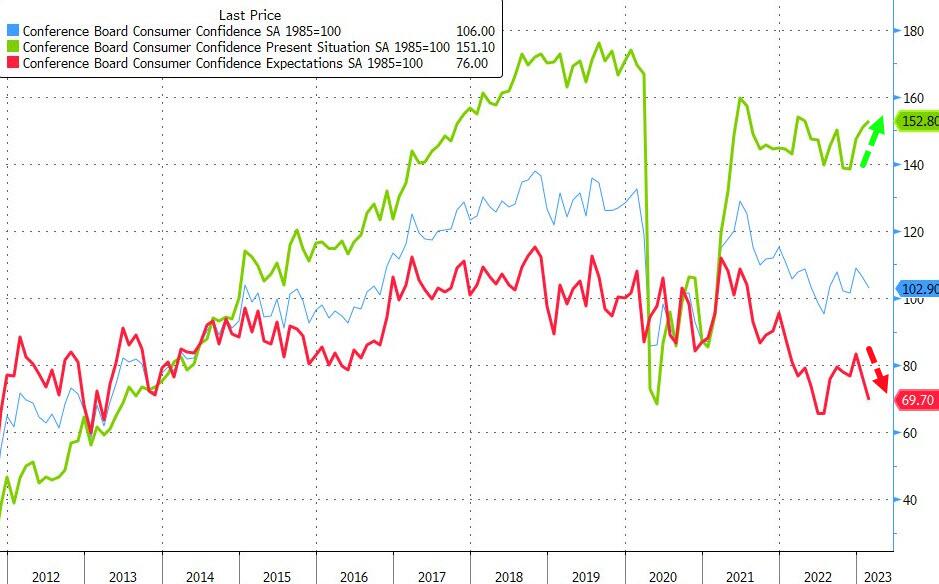
Also, US Home prices plummeted for the 6th straight month in December, which showed the annual growth to be the weakest since July 2020, as ZeroHedge pointed out. But Consumer Confidence expectations improved a tad in February, while inflation rate expectations went the other way and turned higher.
In the end, the weakness in equities can be attributed to one thing, and that is the rally in bond yields with the 2-year gaining almost 60bps, while the 30-year “only” added 30bps, both of which are huge moves and confirm that the Fed’s aggressive inflation stance continues.
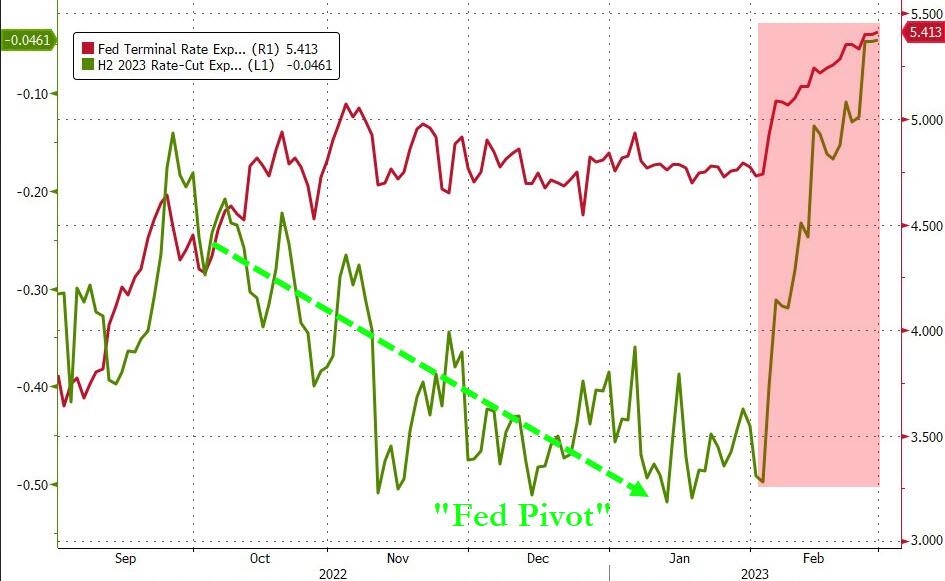
Traders had to swallow that bitter pill, which is also shown in this terminal rate expectation chart, with that number (red line) now approaching 5.5%, while rate cut expectation have simply disappeared, as the Fed pivot promoters now have joined the hawkish crowd.
While the 10-year bond yield is still struggling to break above the 4% level, all action was in the short-term 2-year yield, which broke back above its November highs to reach a point last seen in July 2007. Amazing!
The US Dollar, after struggling in January, surged with a vengeance, thanks to higher rates, and is now back in the green YTD. As a result, Gold moved the opposite way and gave back its January gains.
As we move into March, equities will have a hard time finding a bottom, as continuously higher rates will present a formidable headwind, that is if that trend continues.
2. “Buy” Cycle Suggestions
For the current Buy cycle, which started on 12/1/2022, I suggested you reference my then current StatSheet for ETF selections. However, if you came on board later, you may want to look at the most recent version, which is published and posted every Thursday at 6:30 pm PST.
I also recommend for you to consider your risk tolerance when making your selections by dropping down more towards the middle of the M-Index rankings, should you tend to be more risk adverse. Likewise, a partial initial exposure to the markets, say 33% to start with, will reduce your risk in case of a sudden directional turnaround.
We are living in times of great uncertainty, with economic fundamentals steadily deteriorating, which will eventually affect earnings negatively and, by association, stock prices. I can see this current Buy signal to be short lived, say to the end of the year, and would not be surprised if it ends at some point in January.
In my advisor practice, we are therefore looking for limited exposure in value, some growth and dividend ETFs. Of course, gold has been a core holding for a long time.
With all investments, I recommend the use of a trailing sell stop in the range of 8-12% to limit your downside risk.
3. Trend Tracking Indexes (TTIs)
Our TTIs slipped on this last trading day of February, as bullish sentiment vanished in the second half of the session.
This is how we closed 02/28/2023:
Domestic TTI: +3.66% above its M/A (prior close +3.96%)—Buy signal effective 12/1/2022.
International TTI: +6.74% above its M/A (prior close +7.06%)—Buy signal effective 12/1/2022.
All linked charts above are courtesy of Bloomberg via ZeroHedge.
Contact Ulli