
- Moving the markets
The markets took a hit today, as January’s bullish momentum ran into a glass ceiling, namely the S&P’s 200-day M/A, which had derailed every rally in 2022, as this chart shows:
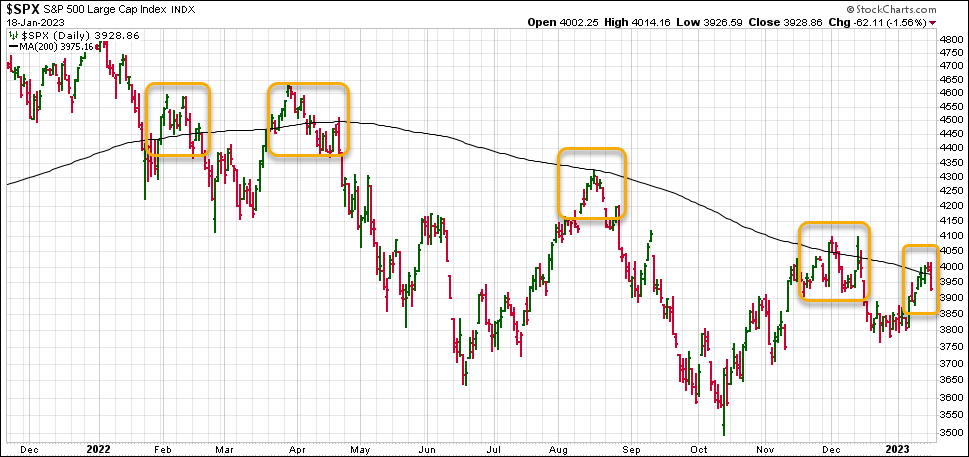
Only time will tell, if this is the beginning of another leg down, after the S&P has now “lost” its 200-day M/A again.
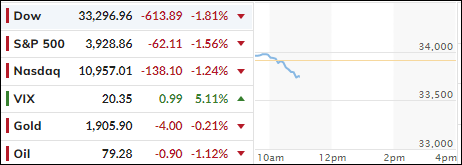
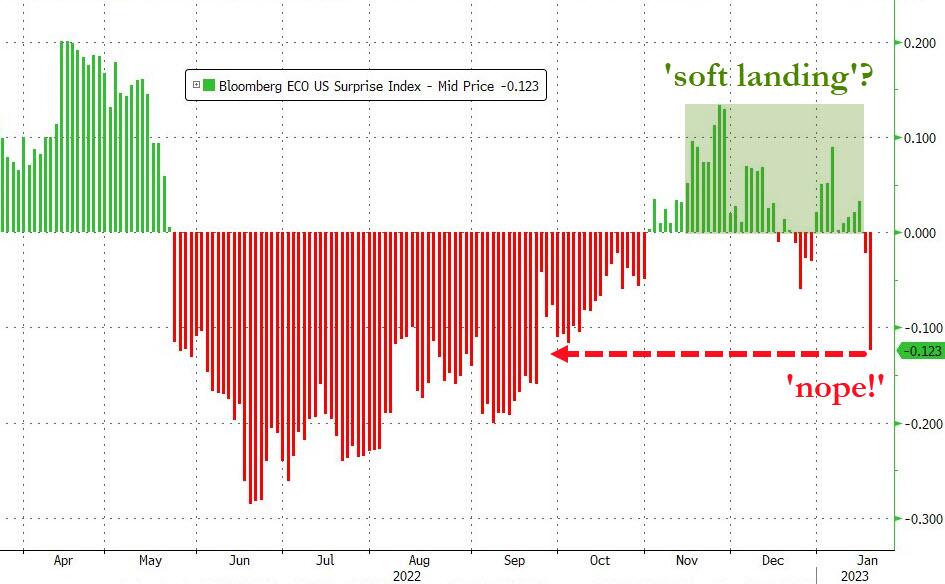
Contributing to today’s Dump-A-Thon were weak economic data points, including huge misses in Producer Price Index (PPI), retail sales and industrial production confirming once again that the economy continues to slide into recession territory. With Microsoft planning on laying off some 10k employees, the Dow suffered the most from today’s sell off.
Sure, after 2 weeks of bullishness, some profit taking has set in, but more so the realization that a recessionary environment is not conducive to higher earnings, because it ultimately decides the value of stock prices.
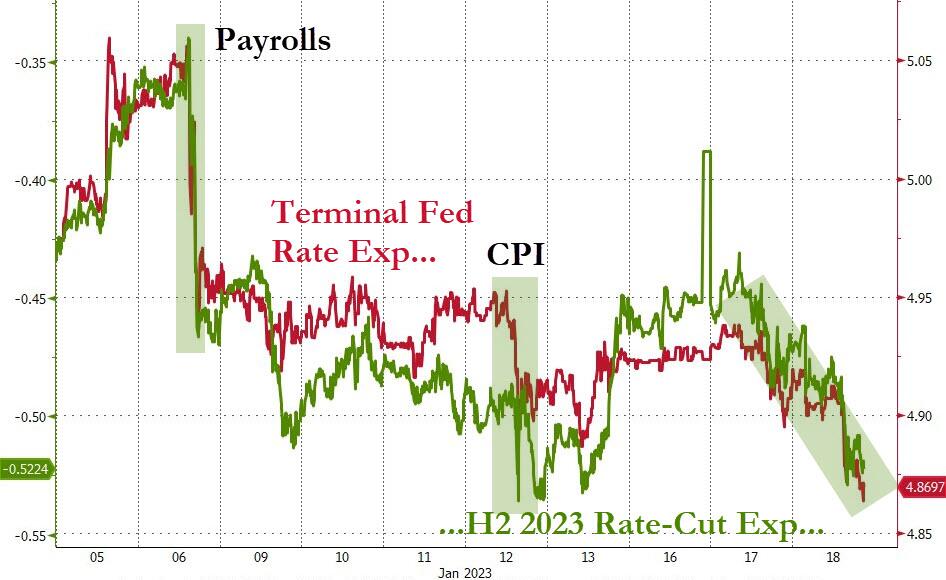
The theme of a soft landing was put on the back burner, as odds of an eventual hard landing have increased due to the above-mentioned weak data points. Even the Fed’s terminal rate expectation took a hit, as traders are convinced that the Fed will pause in May and then begin a massive rate-cutting pivot, as ZeroHedge described it.
That wishful thinking is totally engrained in the Wall Street community, so much so that despite multiple Fed mouthpieces today agreeing that “inflation is down but not enough to stop yet and rates will go higher and stay higher for longer,” market participants are stubbornly sticking to their opposite view.
And, as you might have expected on a sell off like today, the short squeezers had no ammo left for another bullish assist.
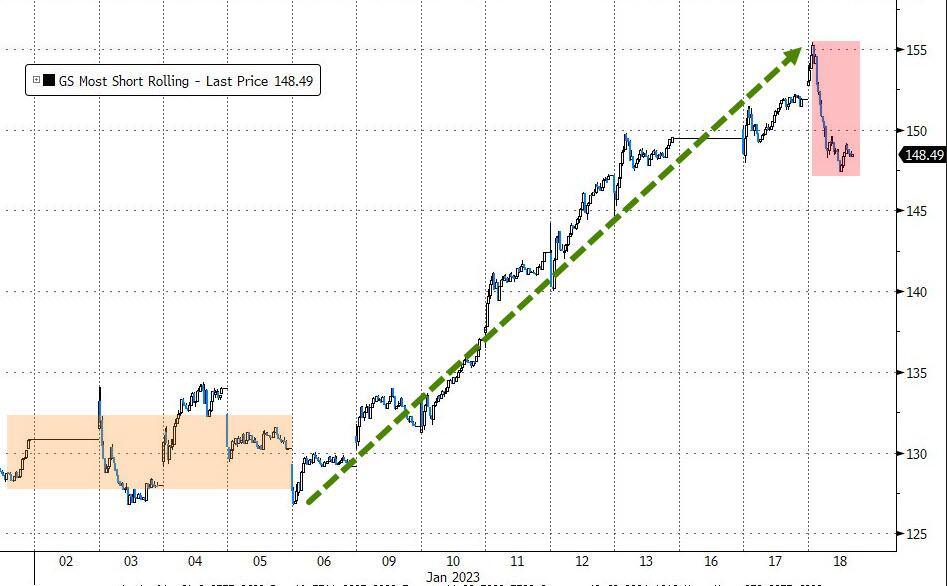
Bond yields plummeted with the 10-year dropping to a level last seen in September. After riding the intra-day roller coaster, the US Dollar ended just about unchanged. Gold followed a similar pattern and closed a tad lower but remained above its $1,900 level.
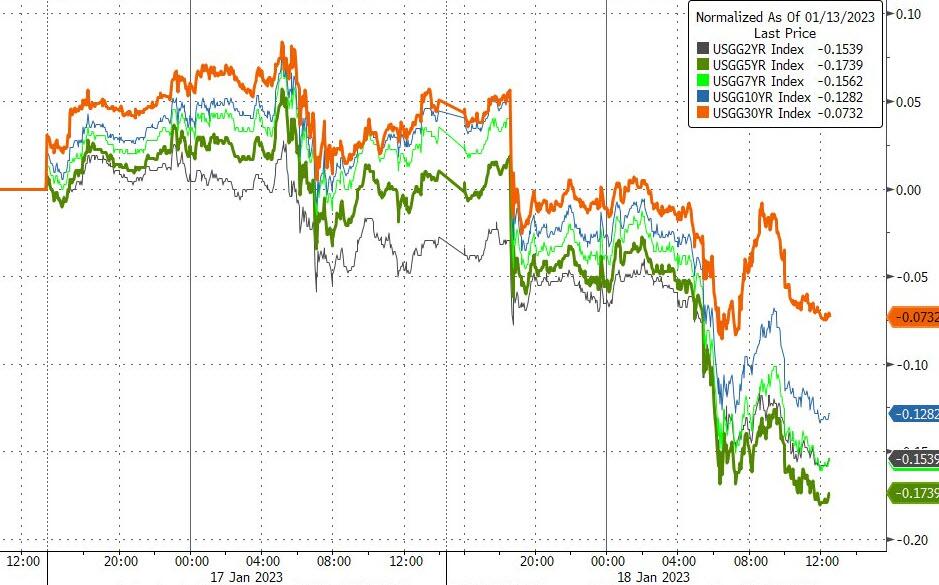
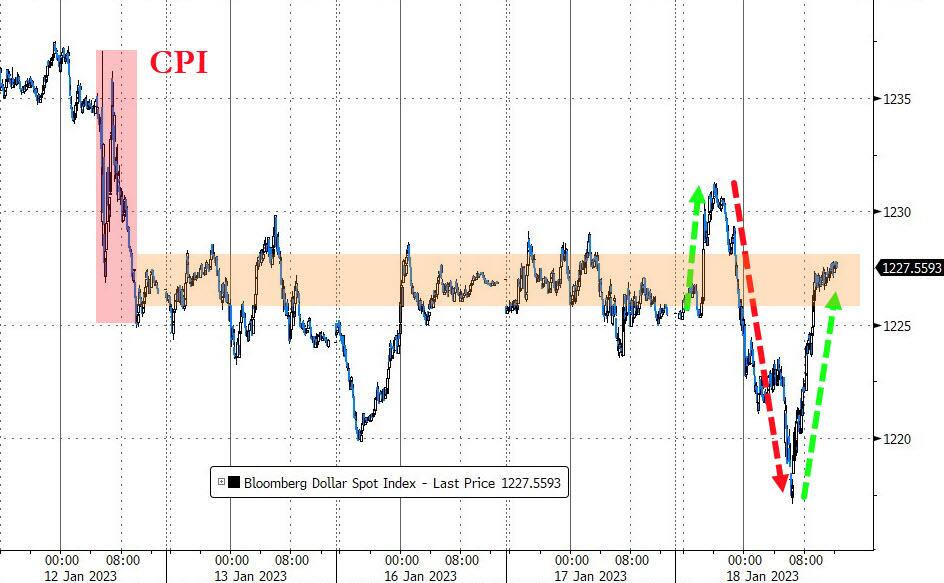
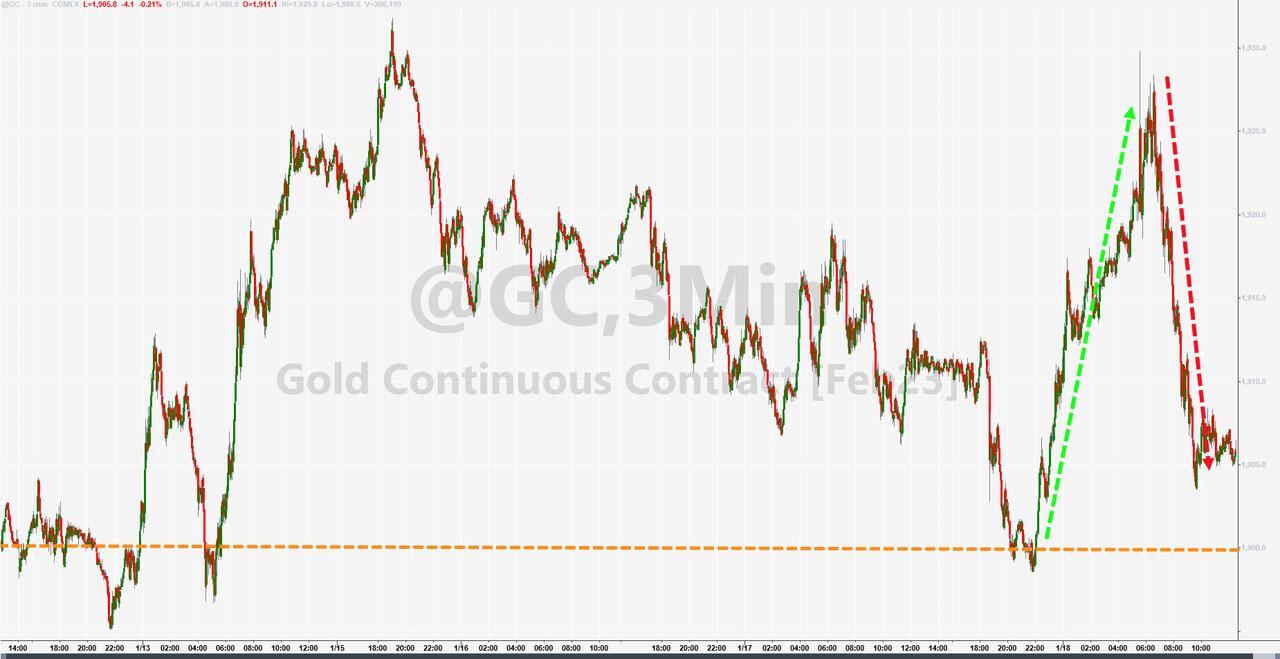
Another battle will be starting tomorrow, as the debt ceiling limit makes its presence known. This may turn into an endless and possibly market moving tug-of-war, until final decisions will have to be made by around June 2023, before the national credit card expires.
2. “Buy” Cycle Suggestions
For the current Buy cycle, which started on 12/1/2022, I suggested you reference my most recent StatSheet for ETFs selections. However, if you came on board later, you may want to look at the most current version, which is published and posted every Thursday at 6:30 pm PST.
I also recommend for you to consider your risk tolerance when making your selections by dropping down more towards the middle of the M-Index rankings, should you tend to be more risk adverse. Likewise, a partial initial exposure to the markets, say 33% to start with, will reduce your risk in case of a sudden directional turnaround.
We are living in times of great uncertainty, with economic fundamentals steadily deteriorating, which will eventually affect earnings negatively and, by association, stock prices. I can see this current Buy signal to be short lived, say to the end of the year, and would not be surprised if it ends at some point in January.
In my advisor practice, we are therefore looking for limited exposure in value, some growth and dividend ETFs. Of course, gold has been a core holding for a long time.
With all investments, I recommend the use of a trailing sell stop in the range of 8-12% to limit your downside risk.
3. Trend Tracking Indexes (TTIs)
Our TTIs took a hit during today’s broad sell off but both remain on the bullish side of their respective trend lines.
This is how we closed 01/18/2023:
Domestic TTI: +4.10% above its M/A (prior close +5.73%)—Buy signal effective 12/1/2022.
International TTI: +8.40% above its M/A (prior close +9.23%)—Buy signal effective 12/1/2022.
Disclosure: I am obliged to inform you that I, as well as my advisory clients, own some of the ETFs listed in the above table. Furthermore, they do not represent a specific investment recommendation for you, they merely show which ETFs from the universe I track are falling within the specified guidelines.
All linked charts above are courtesy of Bloomberg via ZeroHedge.
Contact Ulli