
- Moving the markets
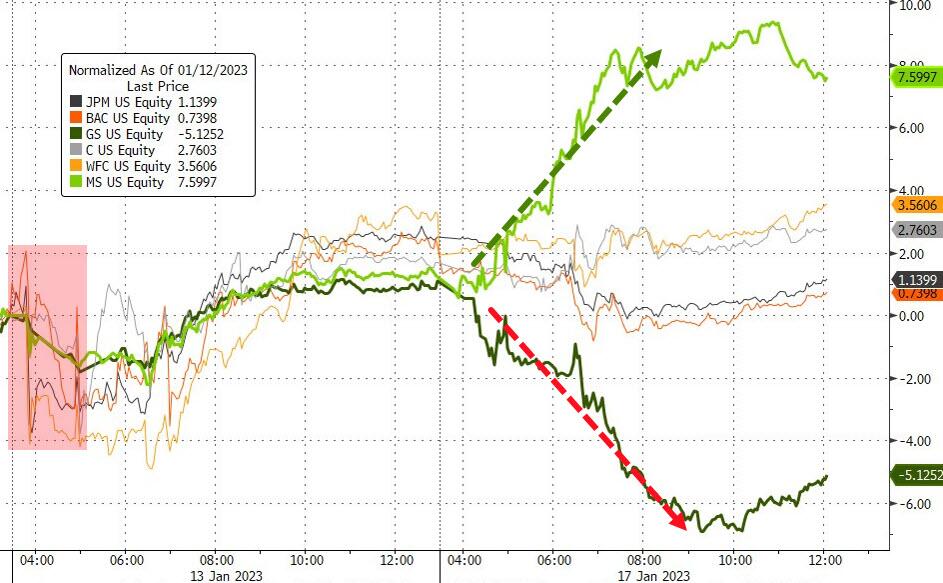
Bank earnings took front and center, as Morgan Stanley posted better-than-expected numbers, thereby pushing up its stock price +6%. However, banking powerhouse Goldman Sachs reported its worst earnings miss in a decade, with its stock price being pummeled at the tune of -6%. JPM’s and Citigroup’s results were mixed.
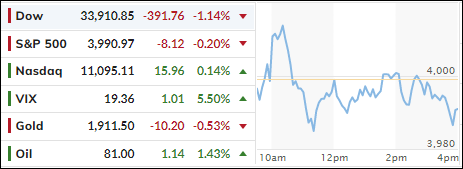
As a result, the effect on the major indexes diverged, with the Dow losing some 400 points, thanks to Goldman Sachs, the S&P 500 dropping a tiny -0.2%, while the Nasdaq squeezed out a green close, albeit a tiny one.
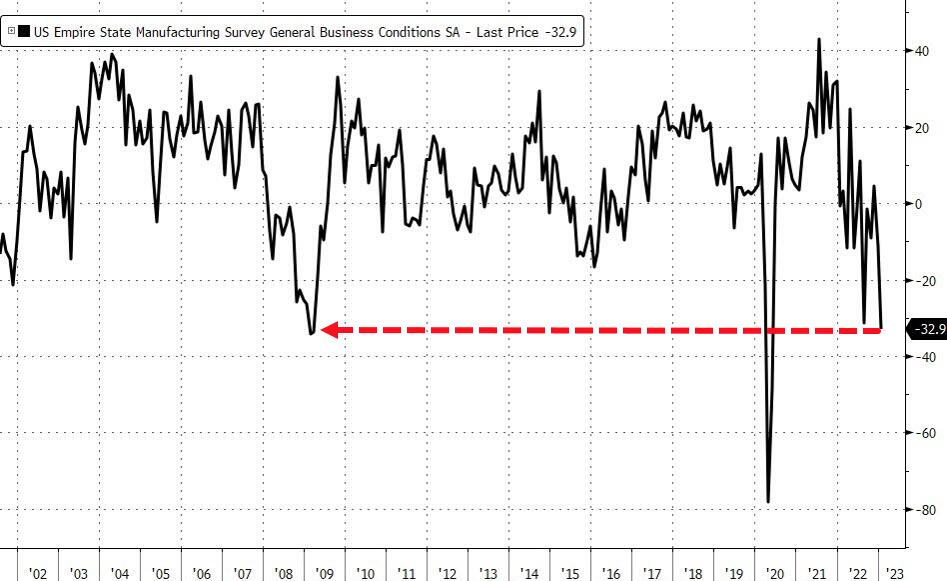
On the economic front, we learned that the Manufacturing Survey, which shows the NY Fed’s general business conditions, simply collapsed, with the index dropping nearly 22 points to -32.9 this month, which was twice as bad as the weakest analyst estimate, as ZeroHedge pointed out.
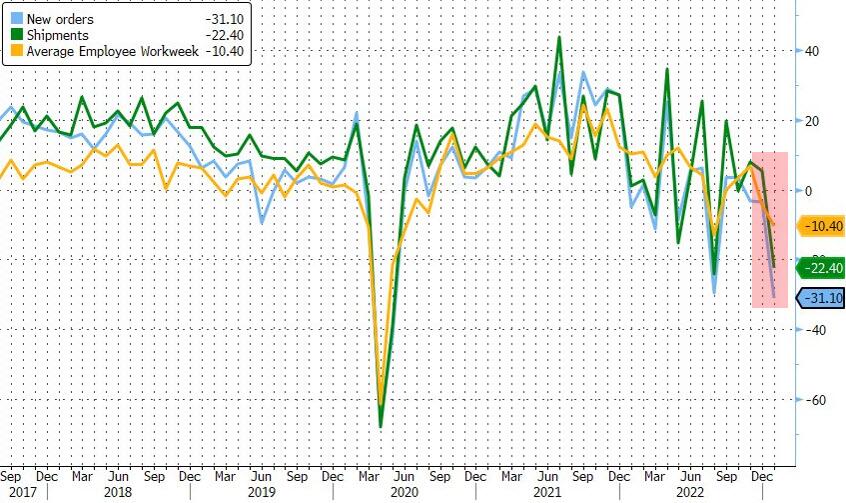
There was no bright spot in the report, as New Orders dropped, Shipments plunged, and Factory Employment fell to its weakest level in more than two years. Ouch! But, not to worry, the theme of a “soft landing” is alive and well.
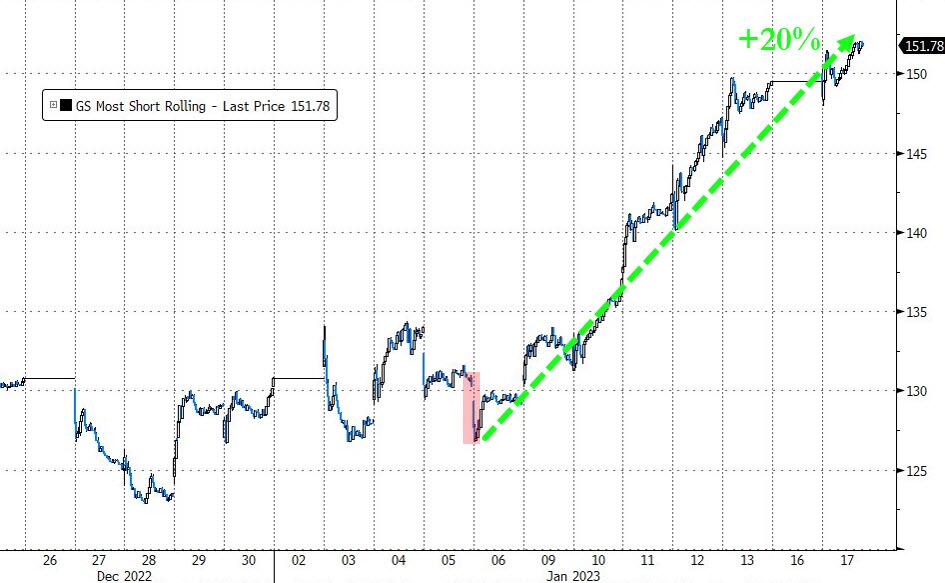
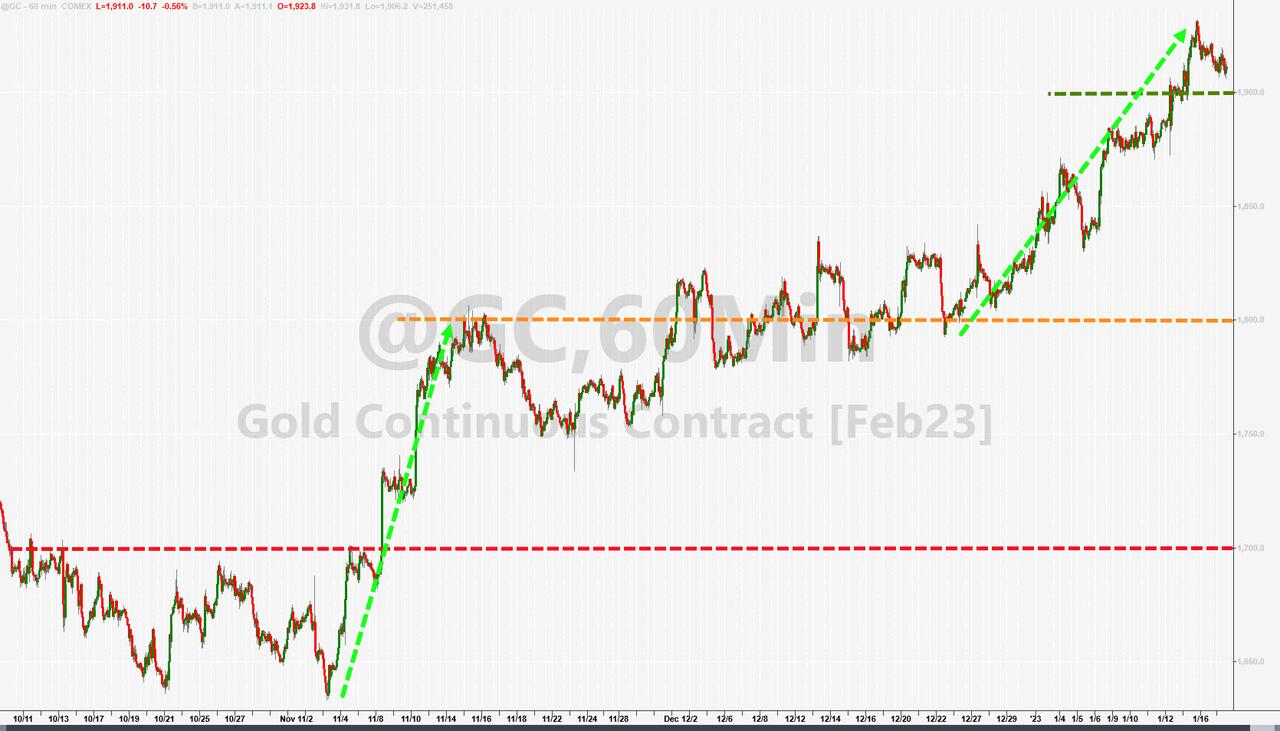
Bond yields were mixed today, the short squeeze continued, the dollar drifted lower, and Gold slipped but remained above its $1,900 level.
Hope continues in the trading community that the Fed will pause or cut rates soon, which is not likely, as lessons learned point to 1980. It was the moment in time when then Fed chairman Volcker cut rates too soon, after the CPI slipped, only to see inflation roar back forcing him to reverse course and go back into hiking mode. Bloomberg demonstrates that phenomenon in this chart.
This is something that the Wall Street crowd has not begun to grasp yet, but once they do, the bears will have a good chance to dominate market direction again.
2. “Buy” Cycle Suggestions
For the current Buy cycle, which started on 12/1/2022, I suggested you reference my most recent StatSheet for ETFs selections. However, if you came on board later, you may want to look at the most current version, which is published and posted every Thursday at 6:30 pm PST.
I also recommend for you to consider your risk tolerance when making your selections by dropping down more towards the middle of the M-Index rankings, should you tend to be more risk adverse. Likewise, a partial initial exposure to the markets, say 33% to start with, will reduce your risk in case of a sudden directional turnaround.
We are living in times of great uncertainty, with economic fundamentals steadily deteriorating, which will eventually affect earnings negatively and, by association, stock prices. I can see this current Buy signal to be short lived, say to the end of the year, and would not be surprised if it ends at some point in January.
In my advisor practice, we are therefore looking for limited exposure in value, some growth and dividend ETFs. Of course, gold has been a core holding for a long time.
With all investments, I recommend the use of a trailing sell stop in the range of 8-12% to limit your downside risk.
3. Trend Tracking Indexes (TTIs)
Our TTIs dropped a tad, as the banking sector cast a shadow on today’s action.
This is how we closed 01/17/2023:
Domestic TTI: +5.73% above its M/A (prior close +5.96%)—Buy signal effective 12/1/2022.
International TTI: +9.23% above its M/A (prior close +9.34%)—Buy signal effective 12/1/2022.
Disclosure: I am obliged to inform you that I, as well as my advisory clients, own some of the ETFs listed in the above table. Furthermore, they do not represent a specific investment recommendation for you, they merely show which ETFs from the universe I track are falling within the specified guidelines.
All linked charts above are courtesy of Bloomberg via ZeroHedge.
Contact Ulli