
- Moving the markets
The markets shrugged off a supply warning from Apple and extended Friday’s bounce into a week that could present unexpected surprises. The obvious one is tomorrow’s mid-term elections, the outcome of which could very well affect the direction of future spending as well as create a political gridlock.
Any kind of stalemate is viewed as a positive for equities, as no new spending plans would be a good outcome for interest rates. However, Thursday’s CPI report, if it comes in higher than expected, will dash any hopes for the bulls and those betting on a Powell “pause” or “pivot,” with a sell-off being a likely possibility.
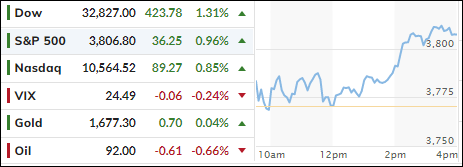
Today’s markets started with a sideways meandering of the indexes, which ZeroHedge described like this:
Markets oscillated quietly ahead of the midterms, then at around 1345ET – with absolutely no headline catalyst – a wave of buying suddenly hit every US index, lifting everything comfortably green on the day…
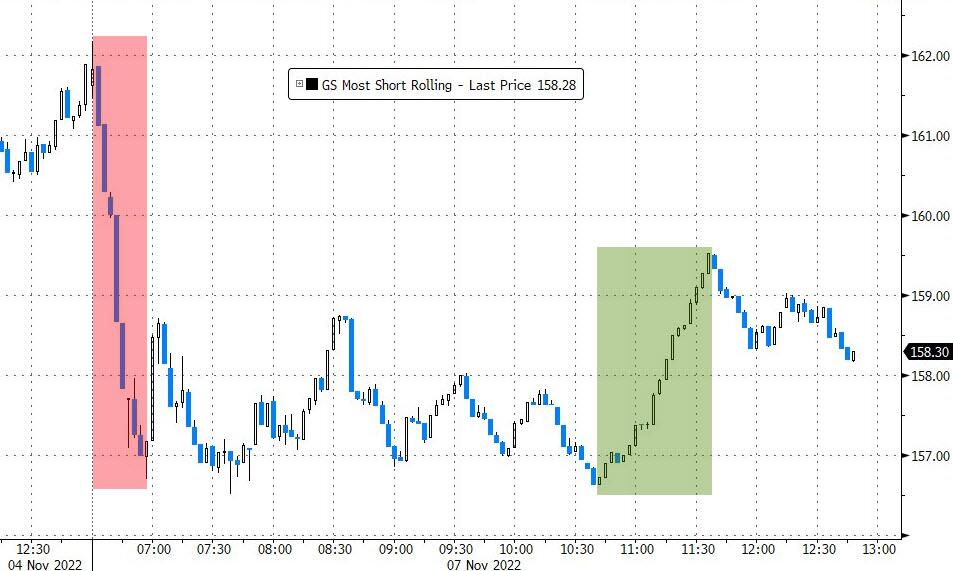
Makes you wonder if the Plunge Protection Team (PPT) had anything got do with it in order to create a positive background, since all other assets dropped on the day. If so, that action was perfectly in sync with an aggressive short squeeze.
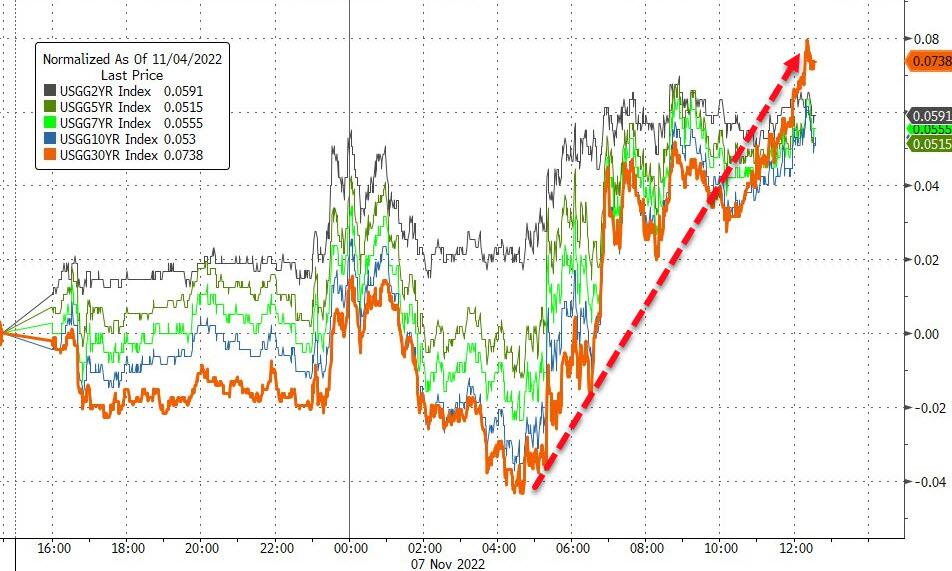
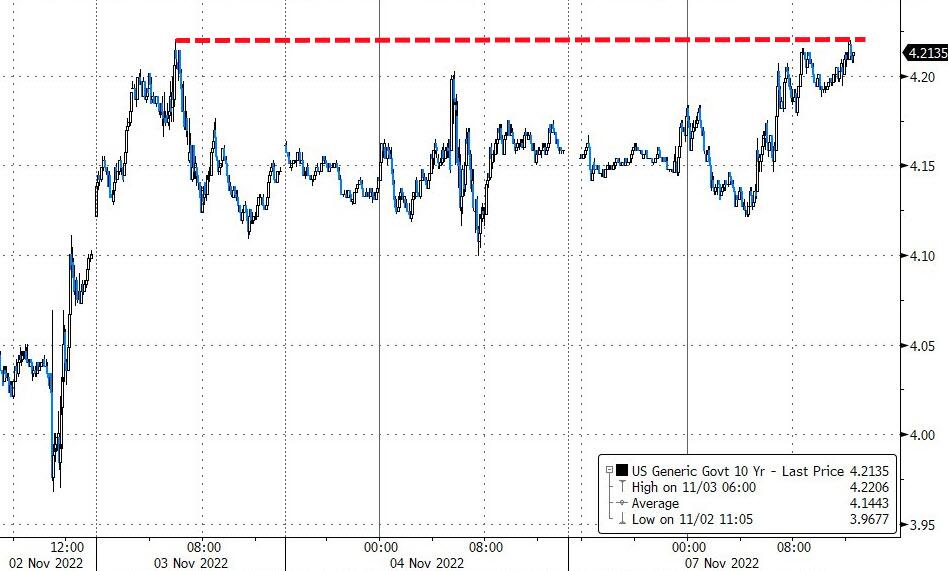
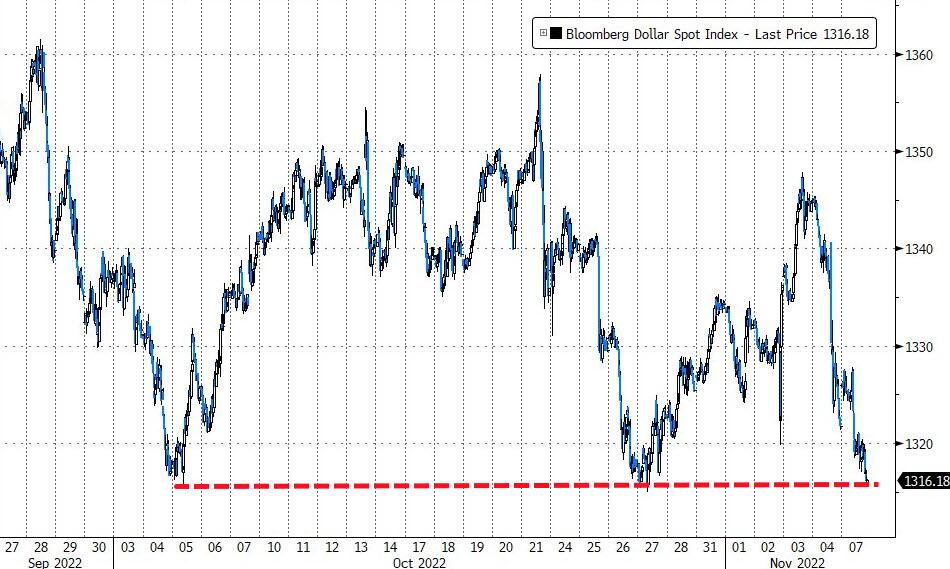
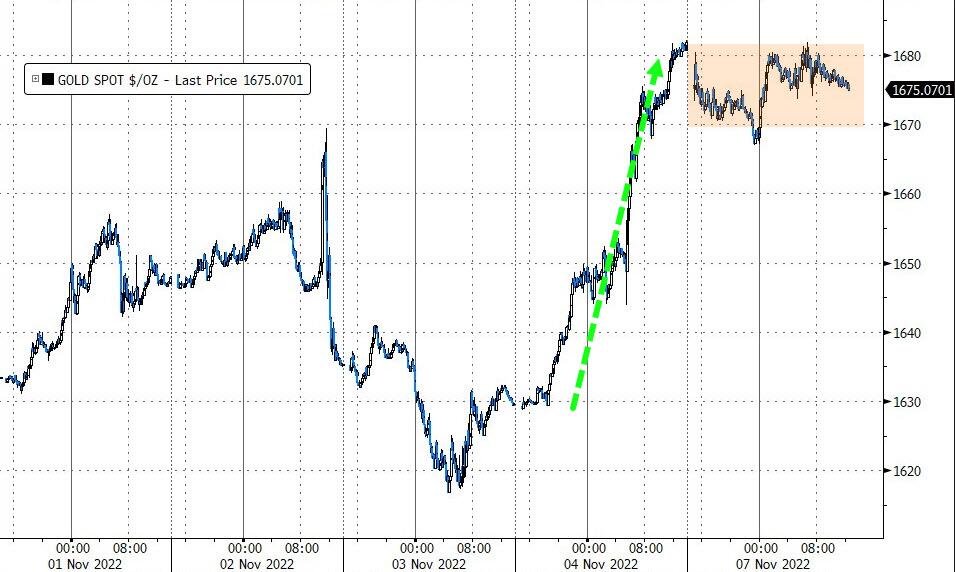
Bond yields rallied mid-day, as the 10-year solidified its position above the much-fought over 4% level by closing at 4.22%, which was up by almost 10bps. The US Dollar slumped again, but gold was not able to take advantage of it, and the precious metals went sideways.
2. ETFs in the Spotlight
In case you missed the announcement and description of this section, you can read it here again.
It features some of the 10 broadly diversified domestic and sector ETFs from my HighVolume list as posted every Saturday. Furthermore, they are screened for the lowest MaxDD% number meaning they have been showing better resistance to temporary sell offs than all others over the past year.
The below table simply demonstrates the magnitude with which these ETFs are fluctuating above or below their respective individual trend lines (%+/-M/A). A break below, represented by a negative number, shows weakness, while a break above, represented by a positive percentage, shows strength.
For hundreds of ETF choices, be sure to reference Thursday’s StatSheet.
For this closed-out domestic “Buy” cycle (2/24/2022), here’s how some of our candidates have fared. Keep in mind that our Domestic Trend Tracking Index (TTI) signaled a “Sell” on that date, which overrode the existing “Buys” shown for SPY and IYM:
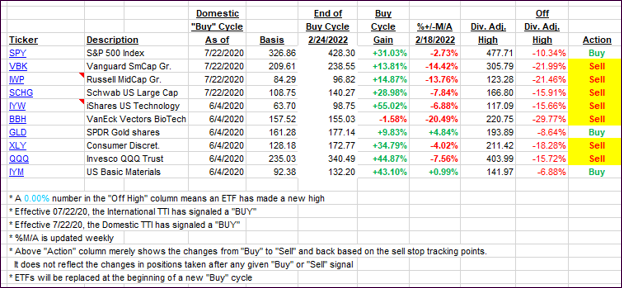
Click image to enlarge.
Again, the %+/-M/A column above shows the position of the various ETFs in relation to their respective long-term trend lines, while the trailing sell stops are being tracked in the “Off High” column. The “Action” column will signal a “Sell” once the -12% point has been taken out in the “Off High” column, which has replaced the prior -8% to -10% limits.
3. Trend Tracking Indexes (TTIs)
Our TTIs improved ahead of tomorrow’s mid-terms and Thursday’s all-important CPI report.
This is how we closed 11/07/2022:
Domestic TTI: -3.03% below its M/A (prior close -3.80%)—Sell signal effective 02/24/2022.
International TTI: -4.90% below its M/A (prior close -5.74%)—Sell signal effective 03/08/2022.
Disclosure: I am obliged to inform you that I, as well as my advisory clients, own some of the ETFs listed in the above table. Furthermore, they do not represent a specific investment recommendation for you, they merely show which ETFs from the universe I track are falling within the specified guidelines.
All linked charts above are courtesy of Bloomberg via ZeroHedge.
Contact Ulli