
- Moving the markets
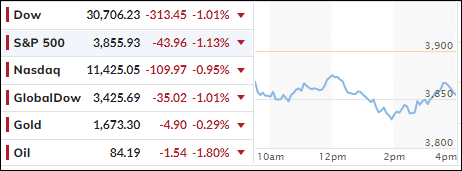
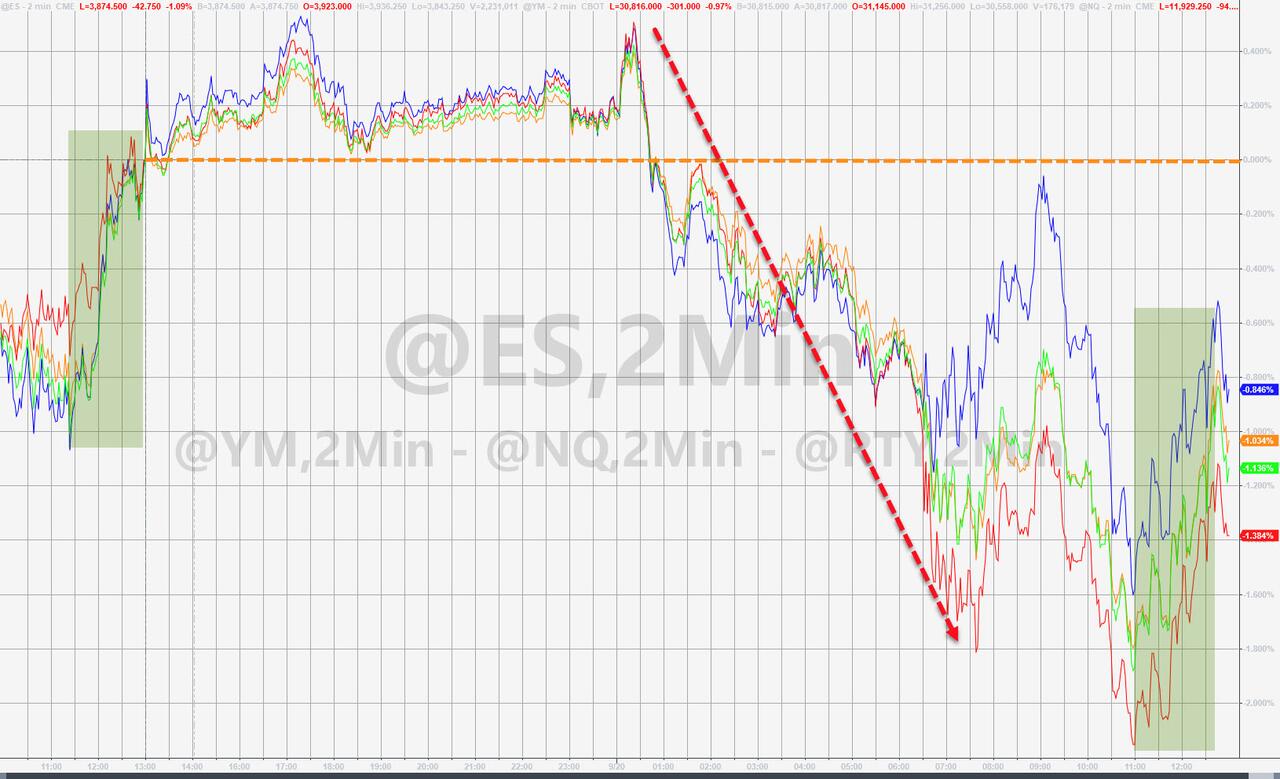
It appeared that Fed anxiety ahead of its key rate decision tomorrow had traders and algos on edge, with the Dow plunging some 400 points mid-session. We recouped some of these steep losses during the last hour, but negative sentiment prevailed due to nobody wanting to have overexposure in equities.
A 0.75% rate hike is widely expected, yet a full 1% could be in the cards as well (but has only a 20% chance), which would very likely cause another plunge in equities. Based on recent hawkish comments by Fed chief Powell, traders appear to have finally gotten the message that a pivot to lower rates is nothing but wishful thinking, hence no frontrunning today before tomorrow’s decision.
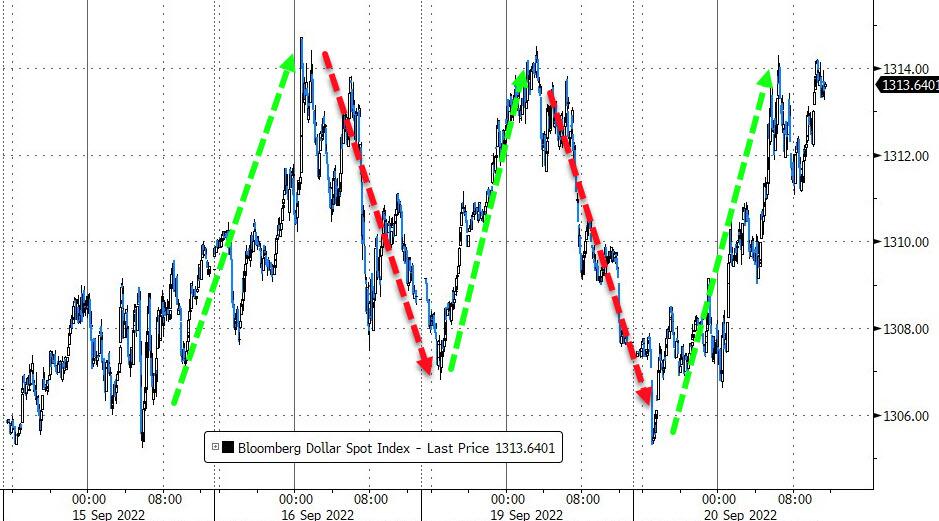
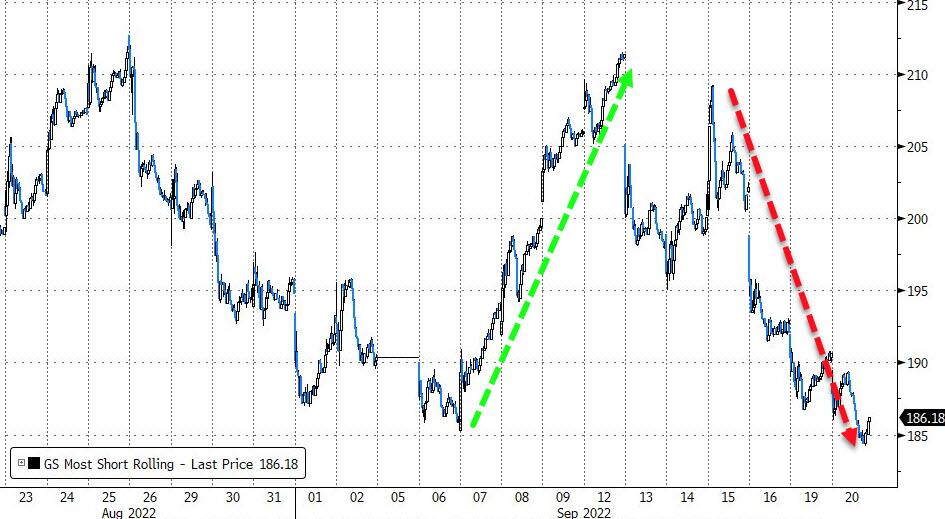
The US Dollar continued its rollercoaster ride of the past few days, strengthened by higher rates, while last week’s short squeeze gains have now been completely erased, as ZeroHedge reported. This again confirms my view that bear market comebacks are ephemeral in nature and simply dead-cat-bounces.
Bond yields surged again with the 10-year almost touching 3.6% but fading into the close to settle at 3.56%, an 11-year high.
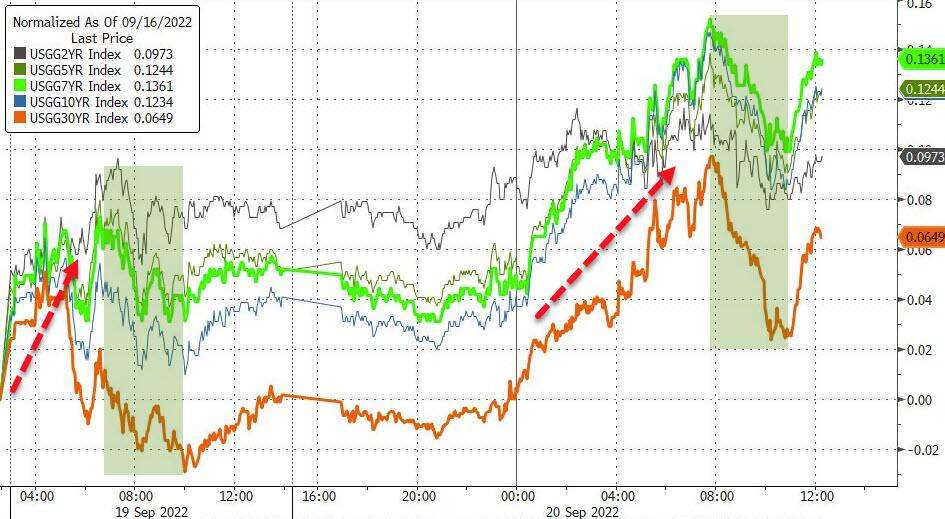
I expect some aimless meandering before the Fed announcement tomorrow but, should they hike no more than 0.75% as expected, we could see a relief rally into the close.
3. ETFs in the Spotlight
In case you missed the announcement and description of this section, you can read it here again.
It features some of the 10 broadly diversified domestic and sector ETFs from my HighVolume list as posted every Saturday. Furthermore, they are screened for the lowest MaxDD% number meaning they have been showing better resistance to temporary sell offs than all others over the past year.
The below table simply demonstrates the magnitude with which these ETFs are fluctuating above or below their respective individual trend lines (%+/-M/A). A break below, represented by a negative number, shows weakness, while a break above, represented by a positive percentage, shows strength.
For hundreds of ETF choices, be sure to reference Thursday’s StatSheet.
For this closed-out domestic “Buy” cycle (2/24/2022), here’s how some of our candidates have fared. Keep in mind that our Domestic Trend Tracking Index (TTI) signaled a “Sell” on that date, which overrode the existing “Buys” shown for SPY and IYM:
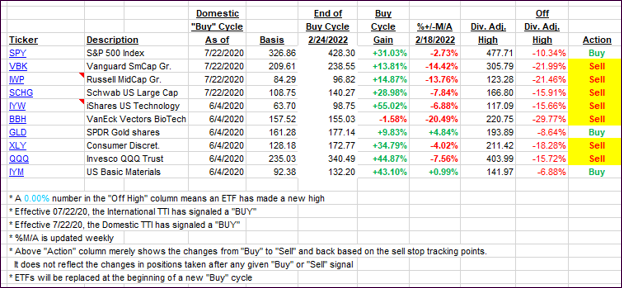
Click image to enlarge.
Again, the %+/-M/A column above shows the position of the various ETFs in relation to their respective long-term trend lines, while the trailing sell stops are being tracked in the “Off High” column. The “Action” column will signal a “Sell” once the -12% point has been taken out in the “Off High” column, which has replaced the prior -8% to -10% limits.
3. Trend Tracking Indexes (TTIs)
Our TTIs dropped, as the bears were clearly in charge.
This is how we closed 09/20/2022:
Domestic TTI: -7.67% below its M/A (prior close -6.16%)—Sell signal effective 02/24/2022.
International TTI: -11.08% below its M/A (prior close -10.10%)—Sell signal effective 03/08/2022.
Disclosure: I am obliged to inform you that I, as well as my advisory clients, own some of the ETFs listed in the above table. Furthermore, they do not represent a specific investment recommendation for you, they merely show which ETFs from the universe I track are falling within the specified guidelines.
All linked charts above are courtesy of Bloomberg via ZeroHedge.
Contact Ulli