
- Moving the markets
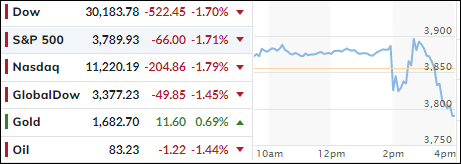
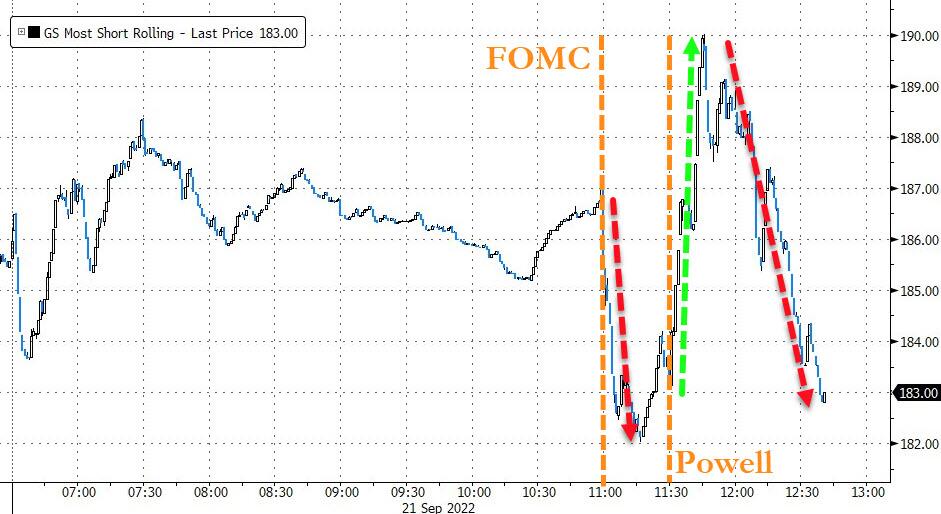
Up until the Fed’s announcement on interest rates, the major indexes marched in sync above their respective unchanged lines sporting modest gains. Just minutes before Powell’s appearance, fear must have gripped the trading community, and we sold off sharply, hovered for a while, after which a rebound rally took us back into the green.
The Fed maintained its hawkish bias, hiked rates by the expected 0.75%, and predicted a big economic slowdown with rising unemployment, because of its continuing battle to conquer the inflation monster.
Apparently, the tone was a little more aggressive than had been hoped for because suddenly the bottom dropped out, and within the last hour the Dow dumped some 750 points to end the session down over 500 points, despite a short squeeze attempt. Ouch!
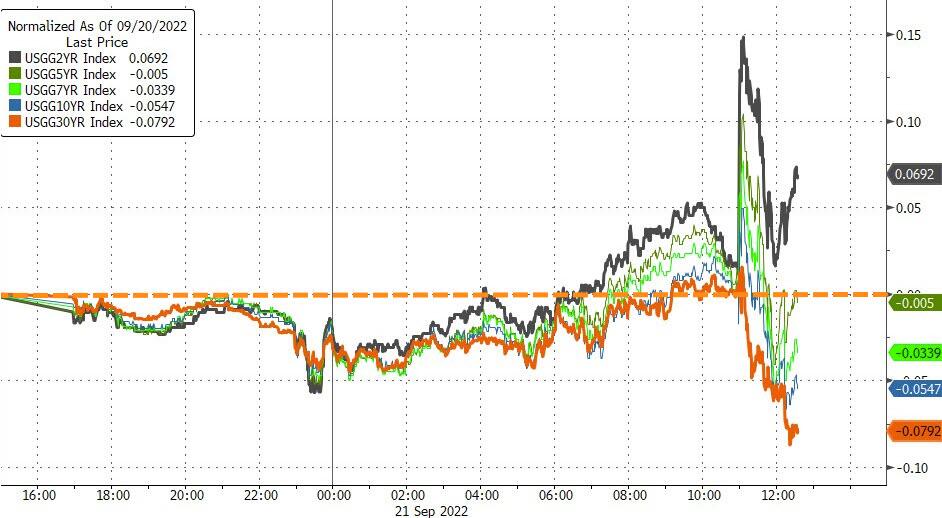
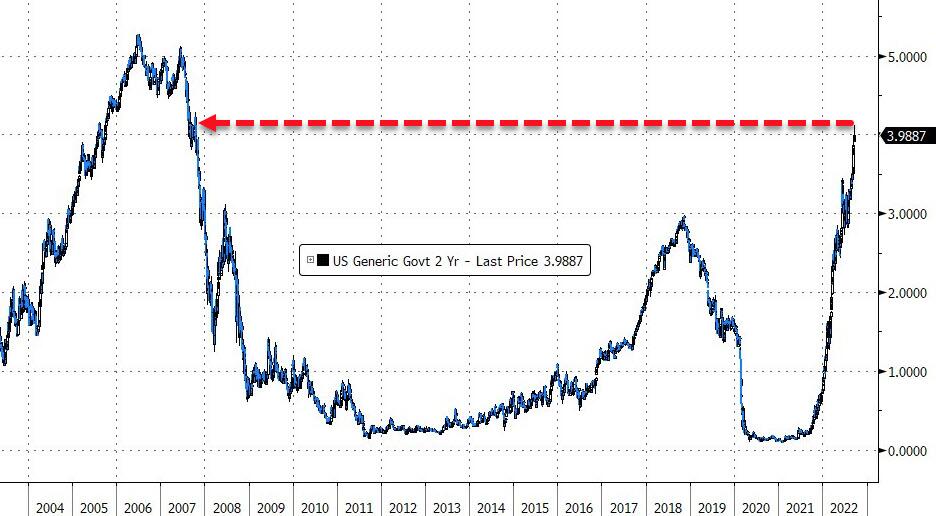
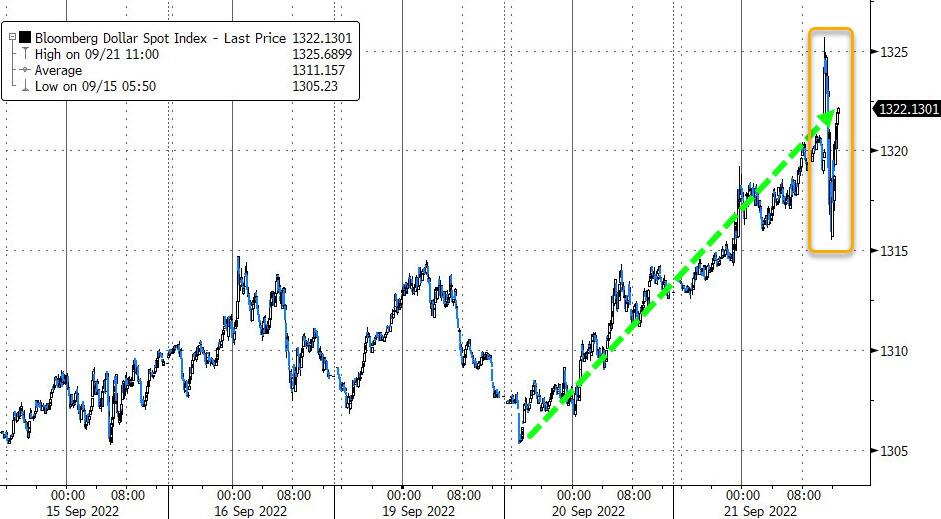
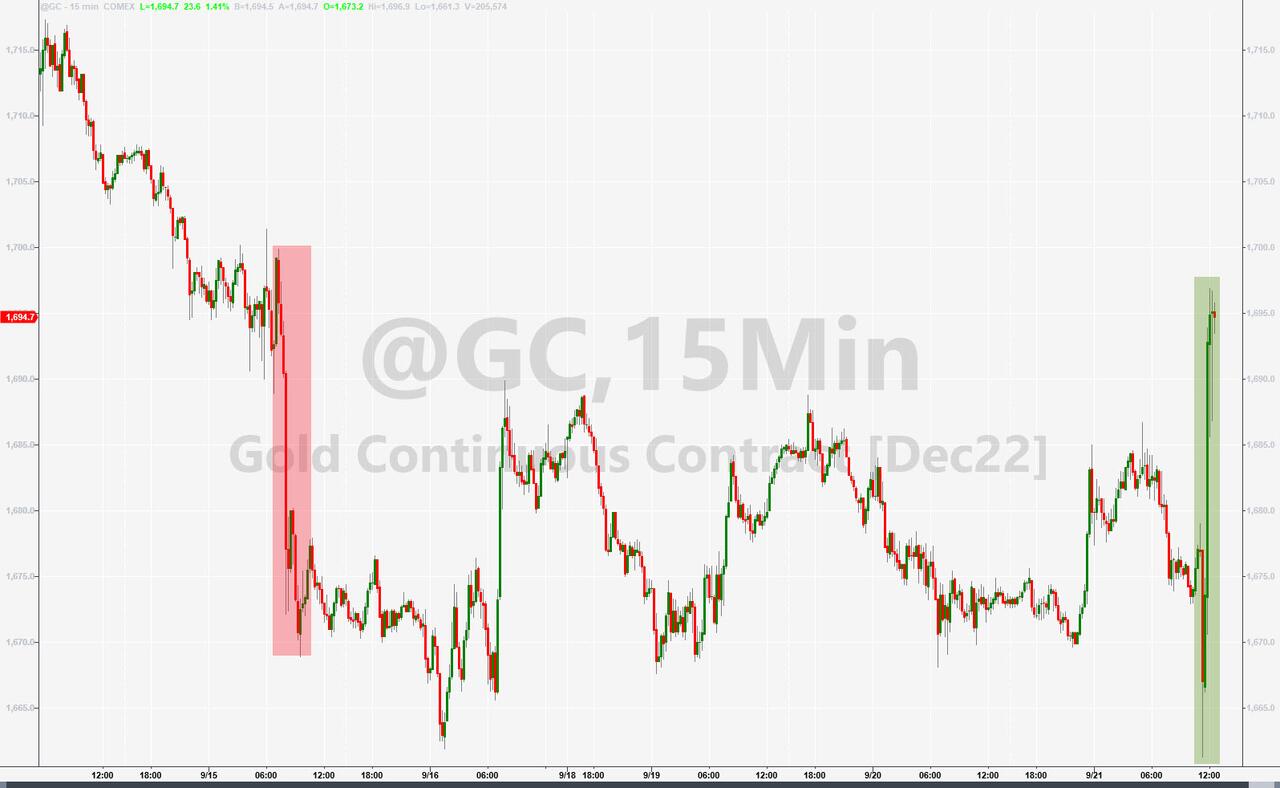
Bond yields rode the roller coaster with the 2-year jumping 7bps, while the 30-year fell 8bps. The 2-year topped 4% for the first time since October 2007 before fading back, as ZeroHedge reported. The US Dollar rallied but was choppy into the close, yet Gold showed signs of life, due all that uncertainty, and raced towards its $1,700 level.
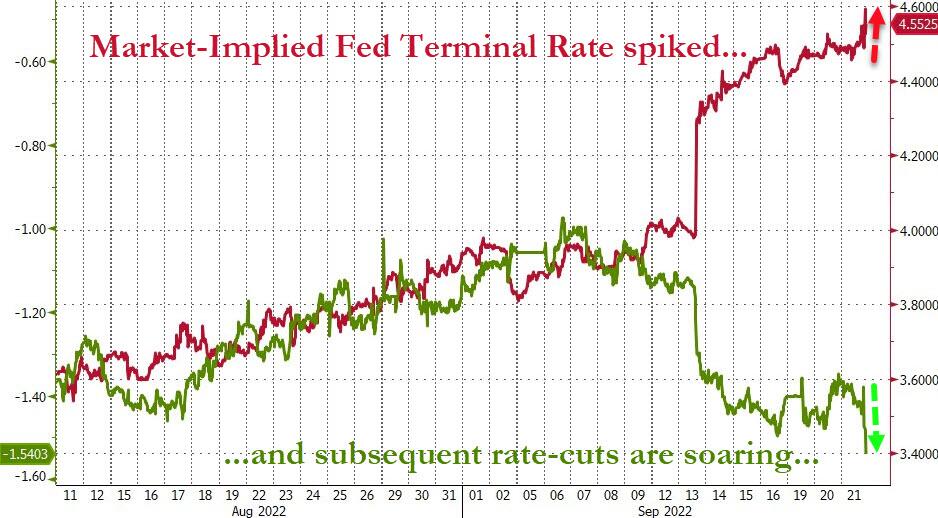
Traders are now expecting the Fed’s Terminal Rate to be around 4.6%, at which moment in time it is assumed that rate cuts will be on deck. To me, that is far from being a number chiseled in stone, since inflation will be with us much longer than is currently assumed.
The lesson the forever bullish crowd had to learn the hard way is this one: “Don’t fight the Fed.”
2. ETFs in the Spotlight
In case you missed the announcement and description of this section, you can read it here again.
It features some of the 10 broadly diversified domestic and sector ETFs from my HighVolume list as posted every Saturday. Furthermore, they are screened for the lowest MaxDD% number meaning they have been showing better resistance to temporary sell offs than all others over the past year.
The below table simply demonstrates the magnitude with which these ETFs are fluctuating above or below their respective individual trend lines (%+/-M/A). A break below, represented by a negative number, shows weakness, while a break above, represented by a positive percentage, shows strength.
For hundreds of ETF choices, be sure to reference Thursday’s StatSheet.
For this closed-out domestic “Buy” cycle (2/24/2022), here’s how some of our candidates have fared. Keep in mind that our Domestic Trend Tracking Index (TTI) signaled a “Sell” on that date, which overrode the existing “Buys” shown for SPY and IYM:
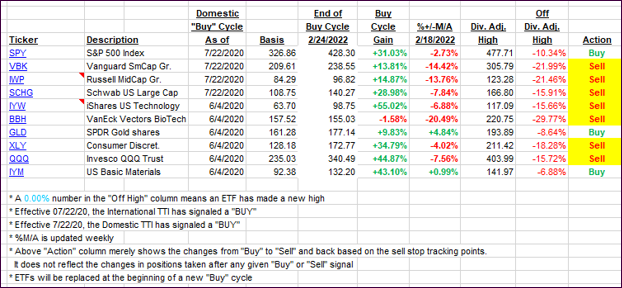
Click image to enlarge.
Again, the %+/-M/A column above shows the position of the various ETFs in relation to their respective long-term trend lines, while the trailing sell stops are being tracked in the “Off High” column. The “Action” column will signal a “Sell” once the -12% point has been taken out in the “Off High” column, which has replaced the prior -8% to -10% limits.
3. Trend Tracking Indexes (TTIs)
Our TTIs got hammered as the markets crashed into the close.
This is how we closed 09/21/2022:
Domestic TTI: -9.20% below its M/A (prior close -7.67%)—Sell signal effective 02/24/2022.
International TTI: -12.34% below its M/A (prior close -11.08%)—Sell signal effective 03/08/2022.
Disclosure: I am obliged to inform you that I, as well as my advisory clients, own some of the ETFs listed in the above table. Furthermore, they do not represent a specific investment recommendation for you, they merely show which ETFs from the universe I track are falling within the specified guidelines.
All linked charts above are courtesy of Bloomberg via ZeroHedge.
Contact Ulli