
- Moving the markets
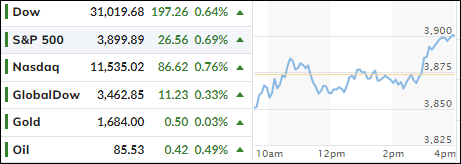
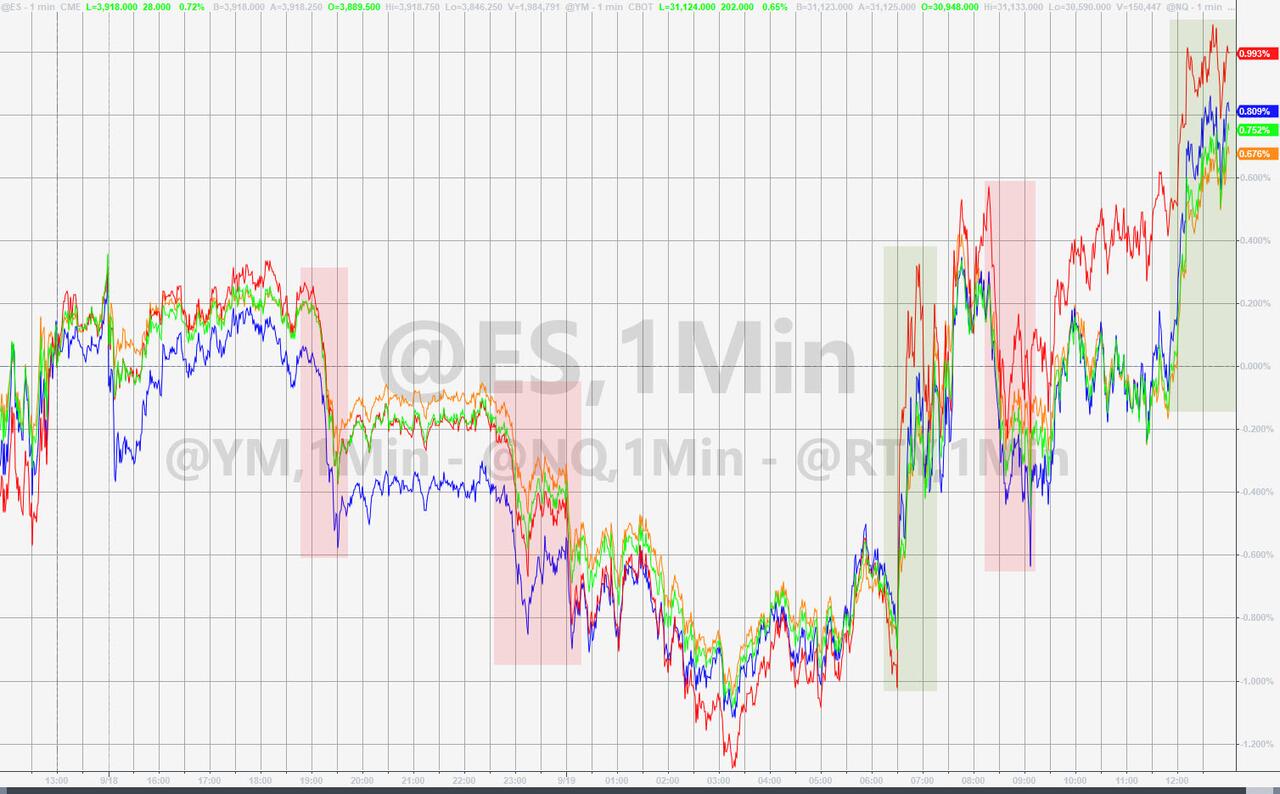
While the major indexes were hugging their respective unchanged lines for most of the session, a last hour breakout allowed equities to close moderately in the green after the thrashing of last week.
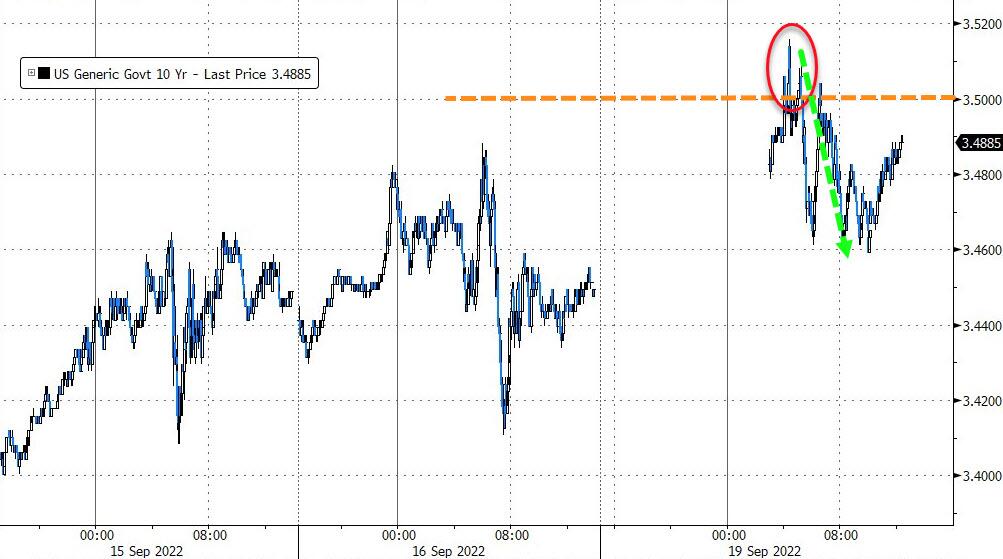
It was aimless meandering for the most part with the Dow trading in a range from -260 points to +180 points. Rising bond yields, ahead of the Fed’s decision on interest rates this Wednesday, pushed the 10-year to 3.51%, it’s highest in 11 years. However, it faded back into the close.
Traders pretty much have accepted an upcoming hike of 75 bps, as the Fed appears to be determined to snuff out inflation, with some analysts even expecting a 100bps increase. It seems that the reality has finally set in that Fed chief Powell will not pivot (to lower rates) as had been hoped for during the summer.
In economic news, we learned that homebuilder sentiment in the US tumbled for the 9th straight month, which is its longest losing streak since 1985, as ZeroHedge reported. That looks to be another nail in the real estate coffin, as mortgage rates have now hit 6%.
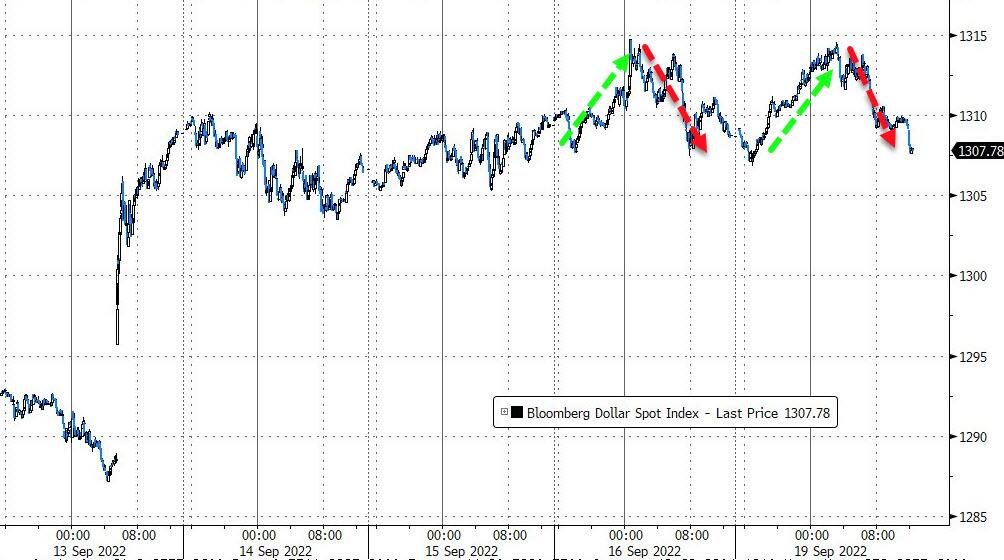
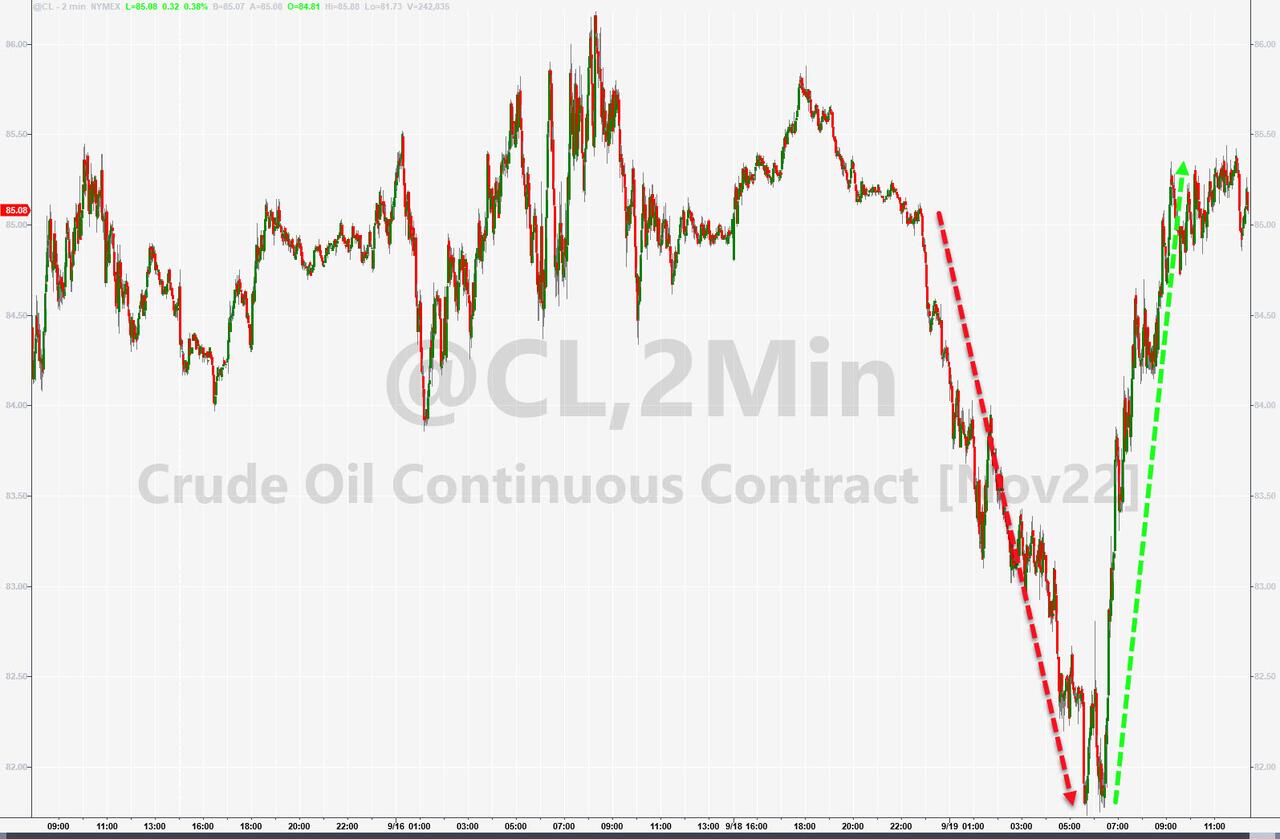
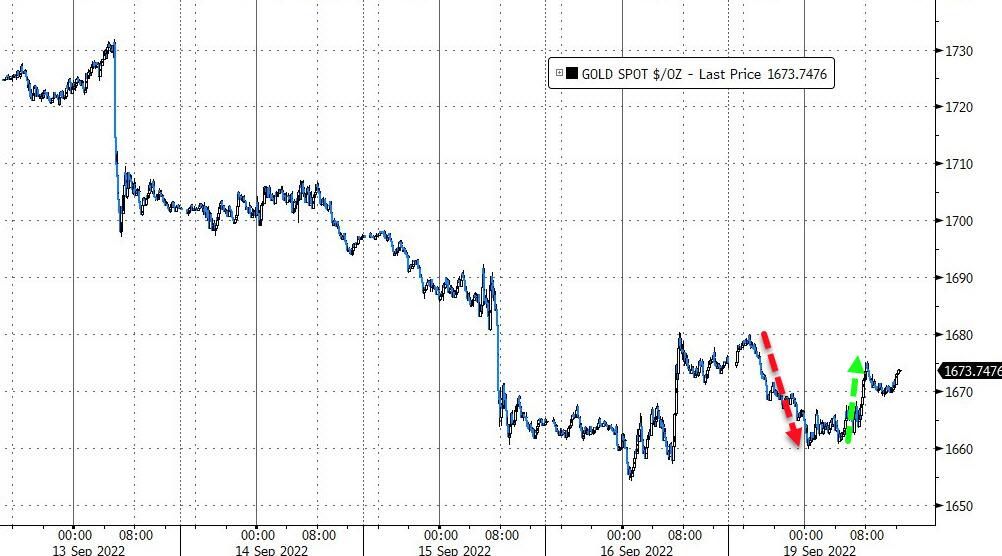
The US Dollar range traded, Crude Oil dumped and pumped, while Gold followed suit.
Added a Bespoke strategist:
The S&P has now traded below its key 200DMA for 110 straight days – the longest streak since the bear markets of 2008-2009 and 2000-2002. It’s going to be hard to get too excited until the S&P moves back above its 200-day moving average.”
That goes along with my thinking that you should be invested only during major uptrends and avoid the choppy and sloppy bear markets rallies and their subsequent breakdowns.
2. ETFs in the Spotlight
In case you missed the announcement and description of this section, you can read it here again.
It features some of the 10 broadly diversified domestic and sector ETFs from my HighVolume list as posted every Saturday. Furthermore, they are screened for the lowest MaxDD% number meaning they have been showing better resistance to temporary sell offs than all others over the past year.
The below table simply demonstrates the magnitude with which these ETFs are fluctuating above or below their respective individual trend lines (%+/-M/A). A break below, represented by a negative number, shows weakness, while a break above, represented by a positive percentage, shows strength.
For hundreds of ETF choices, be sure to reference Thursday’s StatSheet.
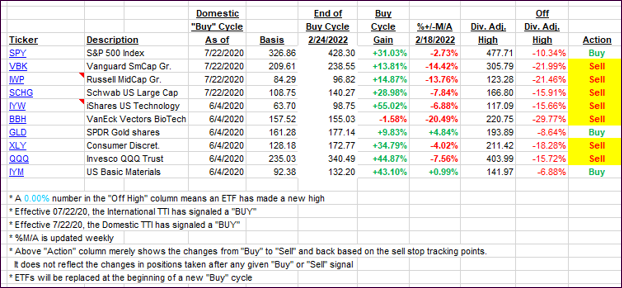
For this closed-out domestic “Buy” cycle (2/24/2022), here’s how some of our candidates have fared. Keep in mind that our Domestic Trend Tracking Index (TTI) signaled a “Sell” on that date, which overrode the existing “Buys” shown for SPY and IYM:
Click image to enlarge.
Again, the %+/-M/A column above shows the position of the various ETFs in relation to their respective long-term trend lines, while the trailing sell stops are being tracked in the “Off High” column. The “Action” column will signal a “Sell” once the -12% point has been taken out in the “Off High” column, which has replaced the prior -8% to -10% limits.
3. Trend Tracking Indexes (TTIs)
Our TTIs slightly improved, as the bulls finally scored a winning session.
This is how we closed 09/19/2022:
Domestic TTI: -6.16% below its M/A (prior close -6.43%)—Sell signal effective 02/24/2022.
International TTI: -10.10% below its M/A (prior close -10.43%)—Sell signal effective 03/08/2022.
Disclosure: I am obliged to inform you that I, as well as my advisory clients, own some of the ETFs listed in the above table. Furthermore, they do not represent a specific investment recommendation for you, they merely show which ETFs from the universe I track are falling within the specified guidelines.
All linked charts above are courtesy of Bloomberg via ZeroHedge.
Contact Ulli