
- Moving the markets
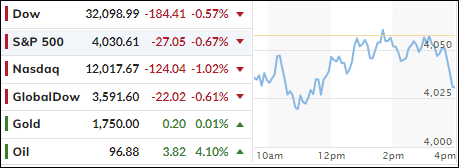
After Friday’s spanking, the major indexes continued their path lower and managed to scramble back far enough to kiss their respective unchanged lines twice. However, upward momentum vanished during the last hour, and we closed in the red again led by the Nasdaq with a 1% loss.
Obviously, rising rates in conjunction with tighter monetary policy gave the bears the upper hand, because Powell’s speech from Jackson Hole still loomed large, as traders finally had to come to terms with the fact that they had misread his resolve to fight inflation.
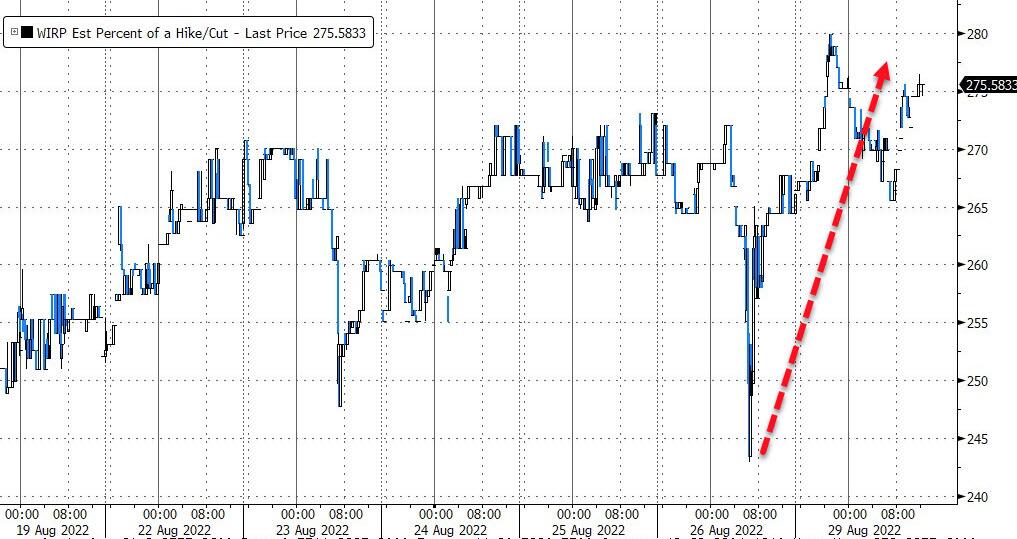
At least for the time being, the much-counted on “Powell-Pivot” remains absent with financial conditions continuing to tighten, as the odds of a 75bps hike in September have risen to 75%.
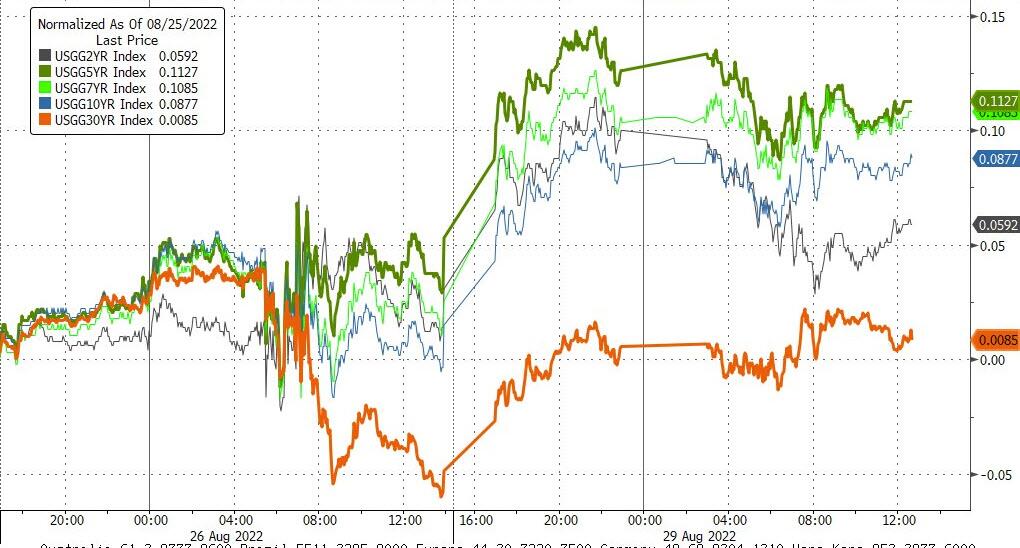
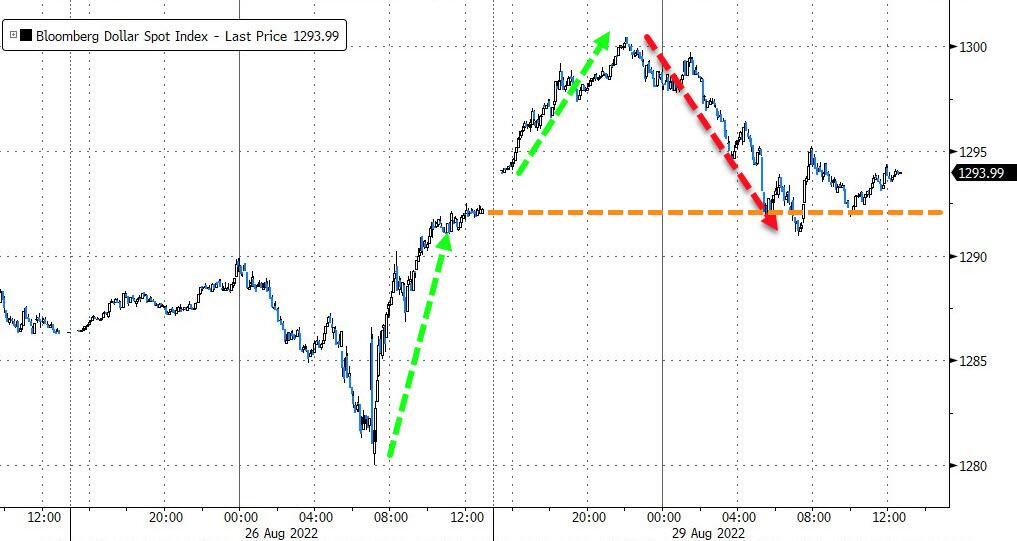
This was also reflected in bond yields, which rose across the board, with the 10-year ramping higher by almost 8 bps to close at 3.11%. The US Dollar pumped and dumped but managed to hold on to Friday’s gains. Gold followed suit and closed a tad above its unchanged line.
Added ZeroHedge:
Bear in mind that this drop in risk assets is what Powell needs – an actual tightening of financial conditions – and should dip-buyer step back in again on hopes that Powell’s “pain” will only last a brief moment, he will re-appear in his most hawkish suit and unleash reality once again until inflation (and speculative longs’ bankrolls) are good and dead.
In other words, higher rates are here to stay, which will not bode well for stock prices.
2. ETFs in the Spotlight
In case you missed the announcement and description of this section, you can read it here again.
It features some of the 10 broadly diversified domestic and sector ETFs from my HighVolume list as posted every Saturday. Furthermore, they are screened for the lowest MaxDD% number meaning they have been showing better resistance to temporary sell offs than all others over the past year.
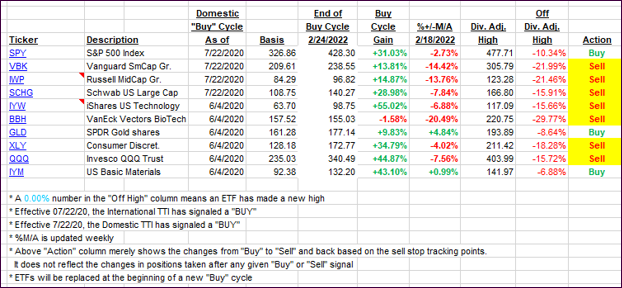
The below table simply demonstrates the magnitude with which these ETFs are fluctuating above or below their respective individual trend lines (%+/-M/A). A break below, represented by a negative number, shows weakness, while a break above, represented by a positive percentage, shows strength.
For hundreds of ETF choices, be sure to reference Thursday’s StatSheet.
For this closed-out domestic “Buy” cycle (2/24/2022), here’s how some of our candidates have fared. Keep in mind that our Domestic Trend Tracking Index (TTI) signaled a “Sell” on that date, which overrode the existing “Buys” shown for SPY and IYM:
Click image to enlarge.
Again, the %+/-M/A column above shows the position of the various ETFs in relation to their respective long-term trend lines, while the trailing sell stops are being tracked in the “Off High” column. The “Action” column will signal a “Sell” once the -12% point has been taken out in the “Off High” column, which has replaced the prior -8% to -10% limits.
3. Trend Tracking Indexes (TTIs)
Our TTIs slipped again, as bullish rebound attempts failed.
This is how we closed 08/29/2022:
Domestic TTI: -4.05% below its M/A (prior close -3.49%)—Sell signal effective 02/24/2022.
International TTI: -7.70% below its M/A (prior close -7.28%)—Sell signal effective 03/08/2022.
Disclosure: I am obliged to inform you that I, as well as my advisory clients, own some of the ETFs listed in the above table. Furthermore, they do not represent a specific investment recommendation for you, they merely show which ETFs from the universe I track are falling within the specified guidelines.
All linked charts above are courtesy of Bloomberg via ZeroHedge.
Contact Ulli