
- Moving the markets
Bullishness during the overnight session vanished in a hurry, with the bears gaining the upper hand again and throwing doubt on a continuation of the summer comeback. The Fed and other global bankers have made it clear that their number one priority is to hike rates to crush inflation, no matter what the negative economic fallout might be.
Seems like traders and algos alike finally got the hint that, given that kind of resolve, corporate profits will be affected, which will then be a downer for stock prices. Sure, eventually the interest rate pendulum will swing the other way again, but we are far away from that moment in time.
NY Fed President John Williams reiterated their position:
I do think with demand far exceeding supply, we do need to get real interest rates … above zero. We need to have somewhat restrictive policy to slow demand, and we’re not there yet.
That statement makes it abundantly clear that the much hoped for “dovish pivot” is not in play and, therefore, the markets will experience more volatility, AKA agony, throughout Q4 of 2022.
A variety of econ headlines, like hotter than expected German inflation, sliding European economic confidence, an unexpected surge in job openings, and better than expected consumer sentiment added up to a mixed menu of good news and bad news, which was not enough to sway the Fed’s path.
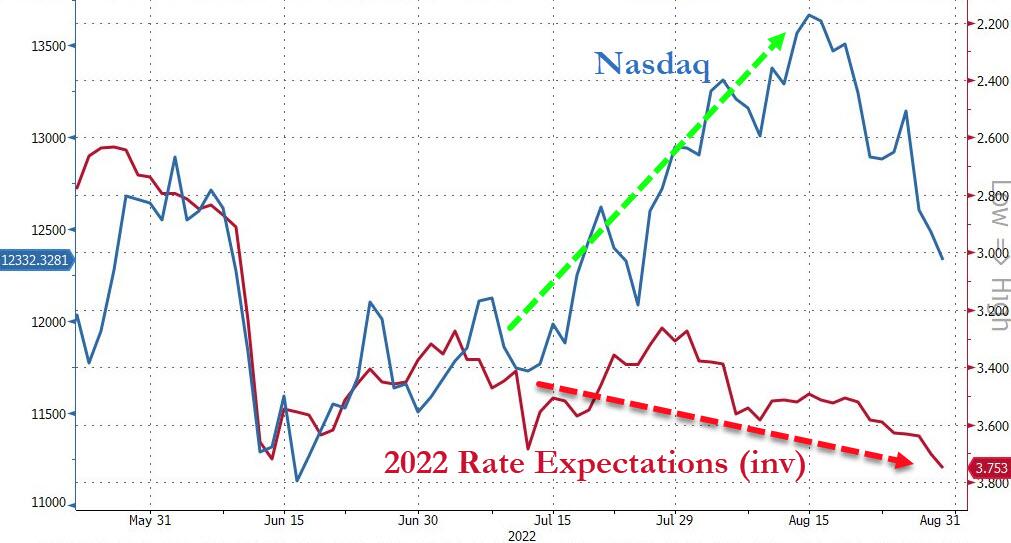
Rate hike expectations shot up and added more discomfort to the fast-fading bullish theme, with ZeroHedge adding that US equities have plenty of downside left before this ‘pain’ is over, as this chart demonstrates.
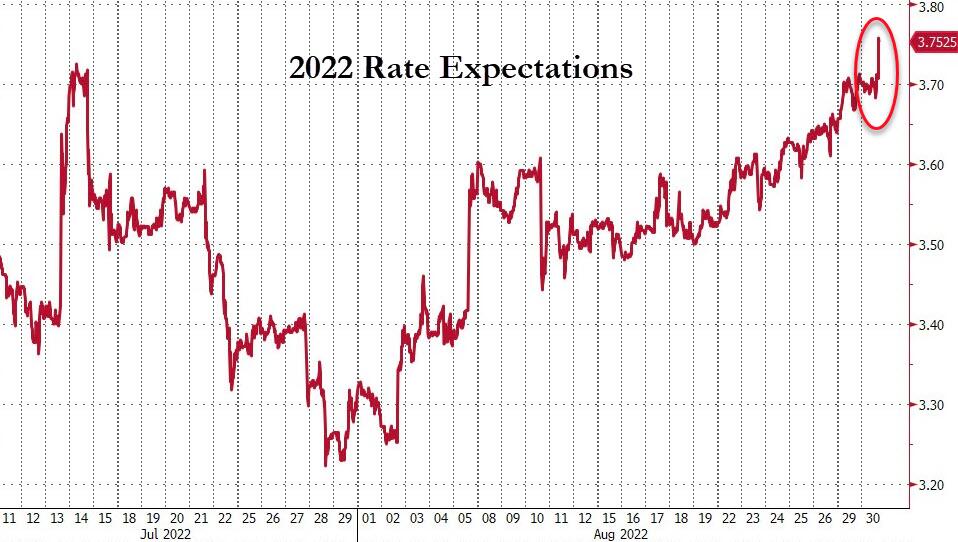
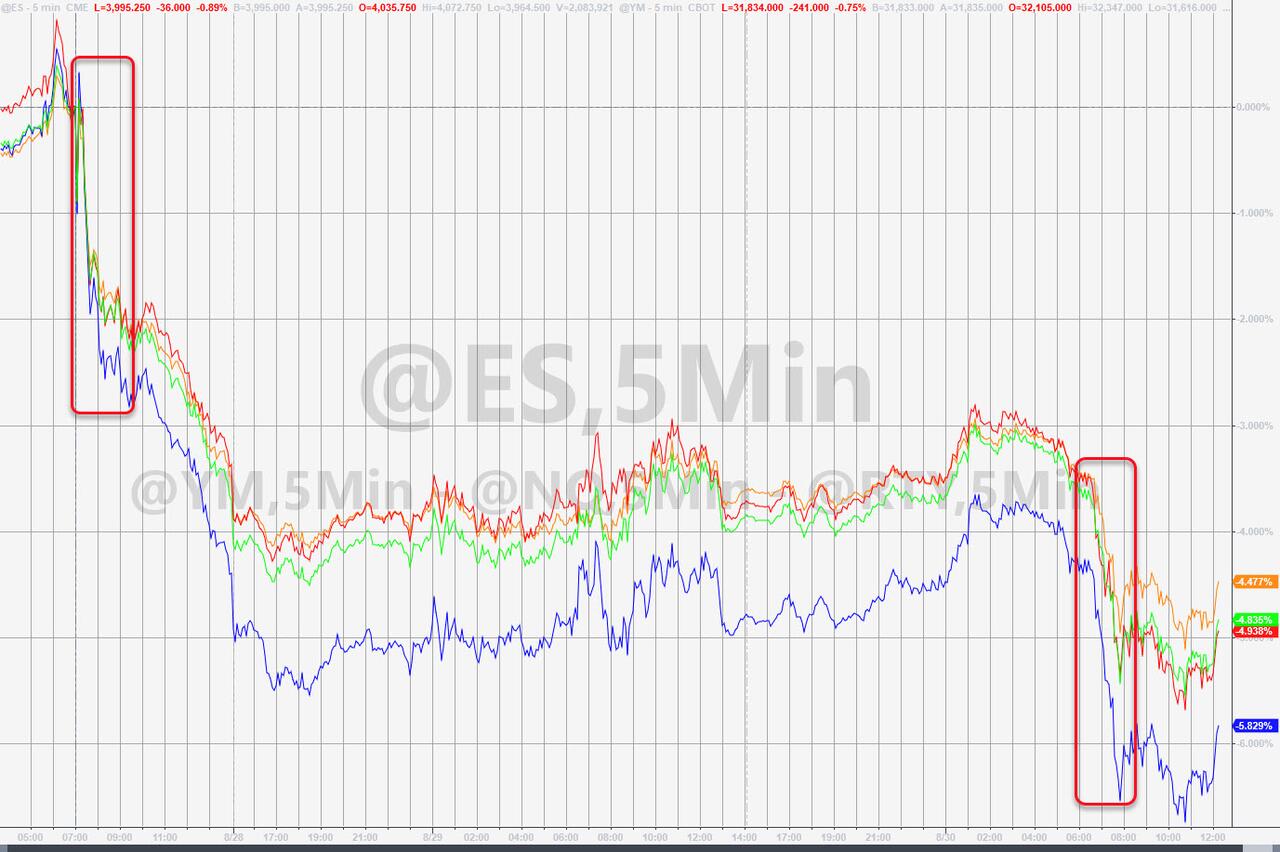
So far, equities have given up more than half of their gains off the mid-June lows, as the Nasdaq has plunged 10% from its mid-August highs. And, as ZH pointed out, the index is down over 6% from the start of Powell’s speech last Friday.
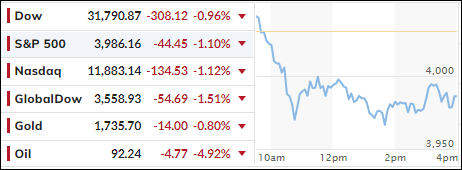
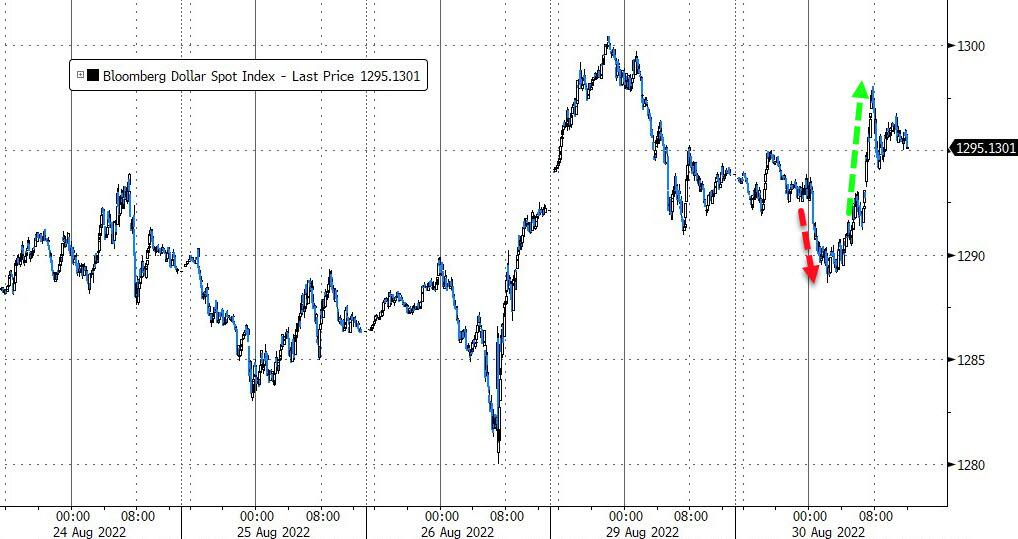
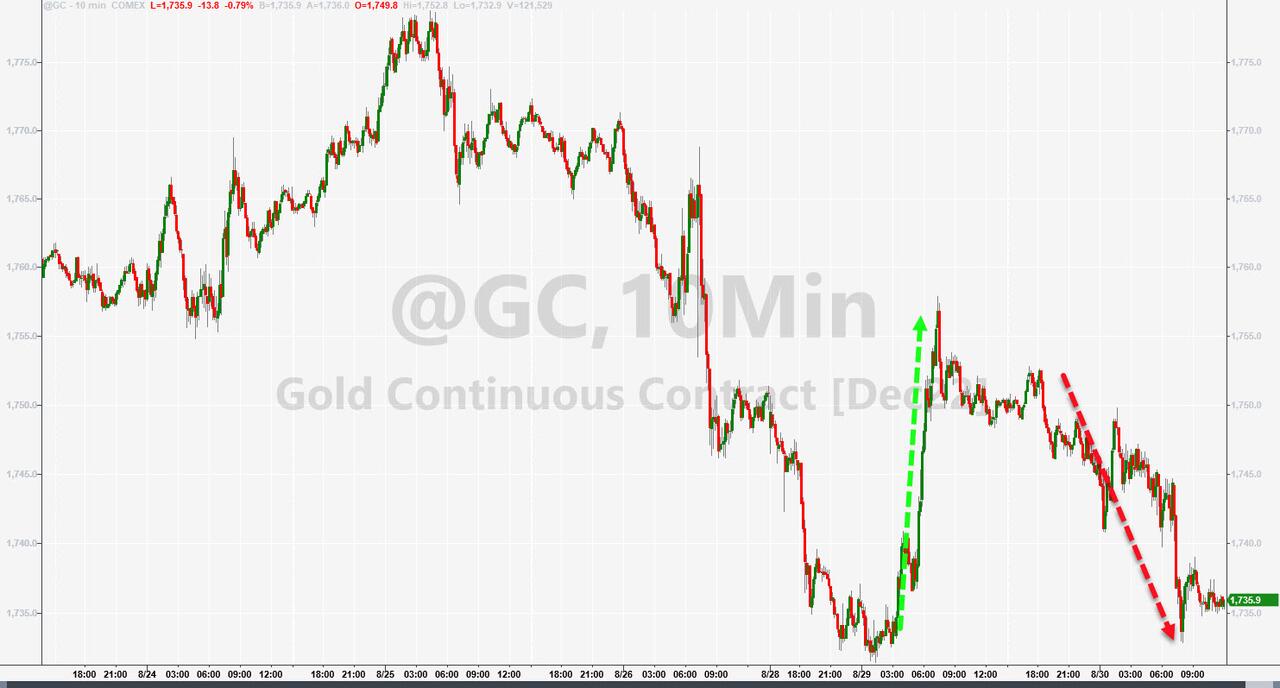
Bond yields were mixed, but the 10-year surged 8bps to close at 3.12%, while the 2-year jumped to its highest since November 2007. The US Dollar flipflopped but ended the day with slight gains, but Gold could not handle the combination of higher yields and a rising dollar and surrendered yesterday’s advances.
From my vantage point, I see more downside pain to come, so it’s satisfying to watch this debacle from the sidelines.
2. ETFs in the Spotlight
In case you missed the announcement and description of this section, you can read it here again.
It features some of the 10 broadly diversified domestic and sector ETFs from my HighVolume list as posted every Saturday. Furthermore, they are screened for the lowest MaxDD% number meaning they have been showing better resistance to temporary sell offs than all others over the past year.
The below table simply demonstrates the magnitude with which these ETFs are fluctuating above or below their respective individual trend lines (%+/-M/A). A break below, represented by a negative number, shows weakness, while a break above, represented by a positive percentage, shows strength.
For hundreds of ETF choices, be sure to reference Thursday’s StatSheet.
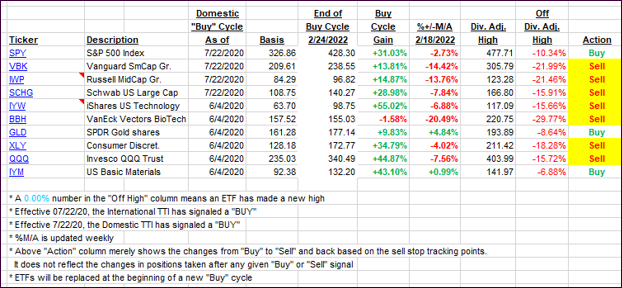
For this closed-out domestic “Buy” cycle (2/24/2022), here’s how some of our candidates have fared. Keep in mind that our Domestic Trend Tracking Index (TTI) signaled a “Sell” on that date, which overrode the existing “Buys” shown for SPY and IYM:
Click image to enlarge.
Again, the %+/-M/A column above shows the position of the various ETFs in relation to their respective long-term trend lines, while the trailing sell stops are being tracked in the “Off High” column. The “Action” column will signal a “Sell” once the -12% point has been taken out in the “Off High” column, which has replaced the prior -8% to -10% limits.
3. Trend Tracking Indexes (TTIs)
Our TTIs slipped again, as bearish momentum was overpowering.
This is how we closed 08/30/2022:
Domestic TTI: -5.06% below its M/A (prior close -4.05%)—Sell signal effective 02/24/2022.
International TTI: -8.53% below its M/A (prior close -7.70%)—Sell signal effective 03/08/2022.
Disclosure: I am obliged to inform you that I, as well as my advisory clients, own some of the ETFs listed in the above table. Furthermore, they do not represent a specific investment recommendation for you, they merely show which ETFs from the universe I track are falling within the specified guidelines.
All linked charts above are courtesy of Bloomberg via ZeroHedge.
Contact Ulli