
- Moving the markets
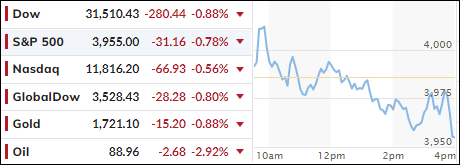
Despite an early bounce, the major indexes did not find any lasting bullish support and chopped around during this last trading day of August without much conviction. As a result, the indexes notched their 4th straight losing session casting further doubt on a much hoped for extension of the June rebound.
That wishful thinking appears to have been dashed for the time being, as much of the gains have evaporated—and that in only 4 trading days, since last Friday, when Fed head Powell asserted his intention of fighting inflation.
For the month, all 3 major indexes lost, with the Dow down -4.1%, while the S&P 500 and Nasdaq gave back -4.2% and -4.6% respectively.
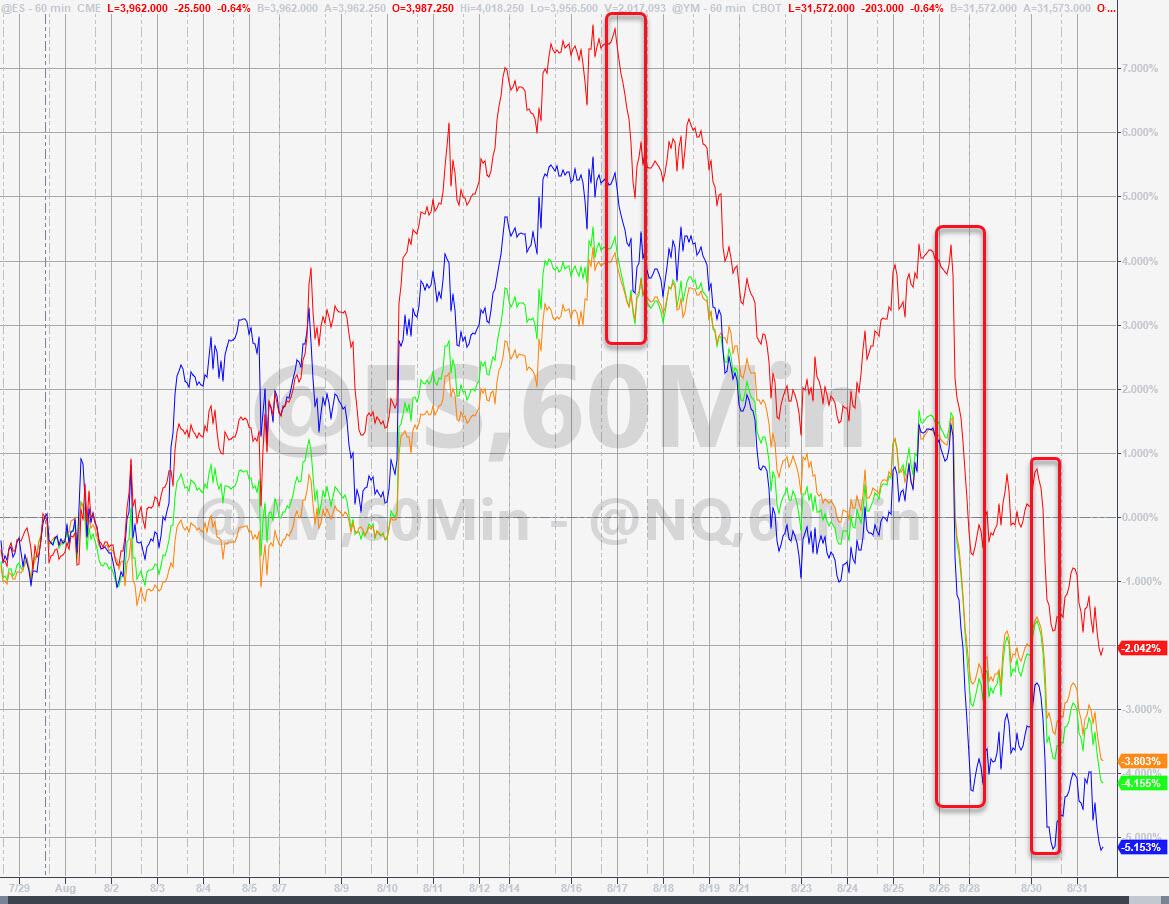
It’s finally beginning to sink in that Wall Street traders and algos alike had counted on, and front ran, limited rate increases and subsequent quick rate cuts, a bet that has now backfired. They had to learn the hard way that increases will be larger and of longer duration with cuts not being visible on the horizon. In other words, a restrictive Fed policy stance will be with us for some time.
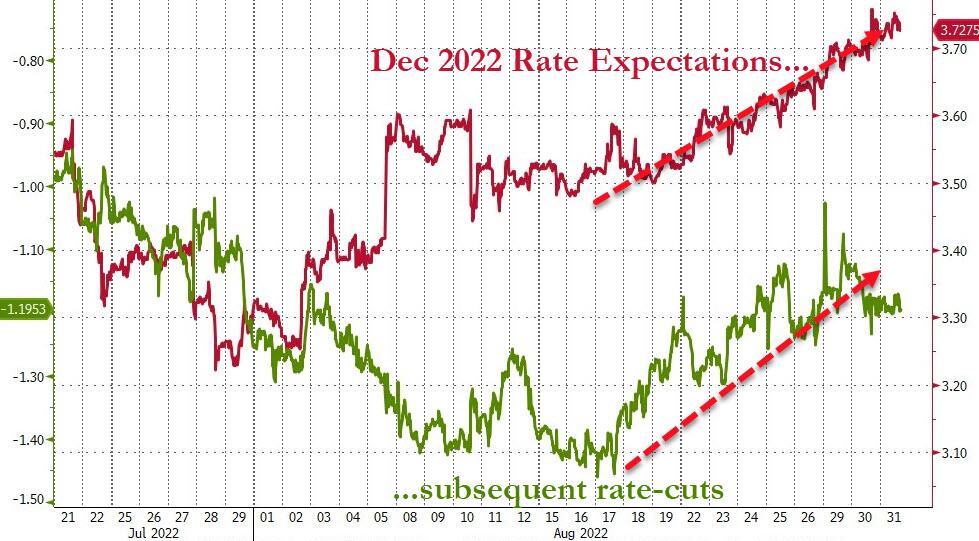
Looking at the big picture, financial conditions eased dramatically from the start of July to mid-August but have tightened since, as ZeroHedge pointed out. That goes along with Rate Hike Expectations and subsequent rate cuts, both of which are painting a hawkish outcome.
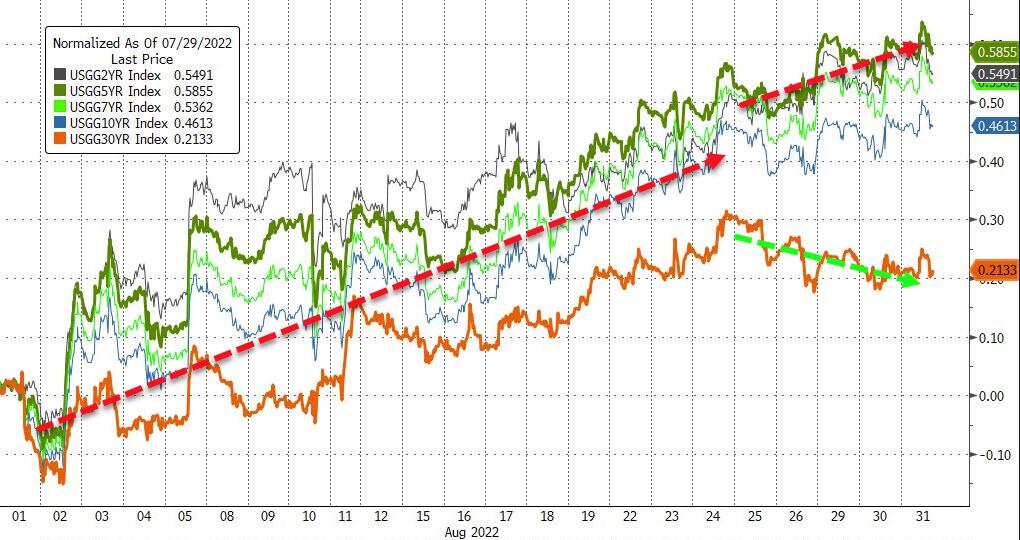
Bond holders got spanked in August as yields soared, thereby negatively affecting bond prices. The widely held 20-year ETF ‘TLT’ dropped -5.9% for the month and is still down -23.77% YTD. Equities did not perform much better with SPY having lost -16.16% YTD. That’s a big “ouch” for the buy-and-hold crowd and things are likely to get worse—before they get much worse.
After all, we are now facing the notoriously volatile September.
2. ETFs in the Spotlight
In case you missed the announcement and description of this section, you can read it here again.
It features some of the 10 broadly diversified domestic and sector ETFs from my HighVolume list as posted every Saturday. Furthermore, they are screened for the lowest MaxDD% number meaning they have been showing better resistance to temporary sell offs than all others over the past year.
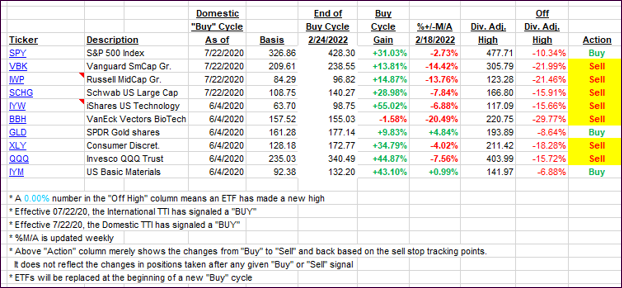
The below table simply demonstrates the magnitude with which these ETFs are fluctuating above or below their respective individual trend lines (%+/-M/A). A break below, represented by a negative number, shows weakness, while a break above, represented by a positive percentage, shows strength.
For hundreds of ETF choices, be sure to reference Thursday’s StatSheet.
For this closed-out domestic “Buy” cycle (2/24/2022), here’s how some of our candidates have fared. Keep in mind that our Domestic Trend Tracking Index (TTI) signaled a “Sell” on that date, which overrode the existing “Buys” shown for SPY and IYM:
Click image to enlarge.
Again, the %+/-M/A column above shows the position of the various ETFs in relation to their respective long-term trend lines, while the trailing sell stops are being tracked in the “Off High” column. The “Action” column will signal a “Sell” once the -12% point has been taken out in the “Off High” column, which has replaced the prior -8% to -10% limits.
3. Trend Tracking Indexes (TTIs)
Our TTIs continued their journey deeper into bearish territory.
This is how we closed 08/31/2022:
Domestic TTI: -5.75% below its M/A (prior close -5.06%)—Sell signal effective 02/24/2022.
International TTI: -9.31% below its M/A (prior close -8.53%)—Sell signal effective 03/08/2022.
Disclosure: I am obliged to inform you that I, as well as my advisory clients, own some of the ETFs listed in the above table. Furthermore, they do not represent a specific investment recommendation for you, they merely show which ETFs from the universe I track are falling within the specified guidelines.
All linked charts above are courtesy of Bloomberg via ZeroHedge.
Contact Ulli