
- Moving the markets
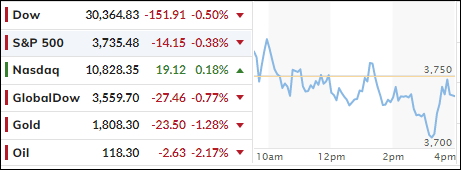
After an early pump, which faded in a hurry, the major indexes dug themselves another hole, but a late session bounce helped avoid a much worse outcome. Still, the Dow and S&P 500 scored another loss, with the Nasdaq clinging to its unchanged line and closing in the green by a tiny margin.
Of course, there was not much bullishness to be found anywhere due to traders’ anxiety ahead of the Fed’s announcement on interest rates tomorrow. The much anticipated 50 bps increase has now been replaced by expectations of 75 bps with an outside possibility of 100 bps. The latter would sure cause havoc with the markets.
Much confidence in the Fed has been lost, as they wasted almost an entire year referring to inflation as being transitory and therefore letting the monster get out of control. As I always said, trying to contain inflation, once it has charted its course, is like putting the tooth paste back in the tube.
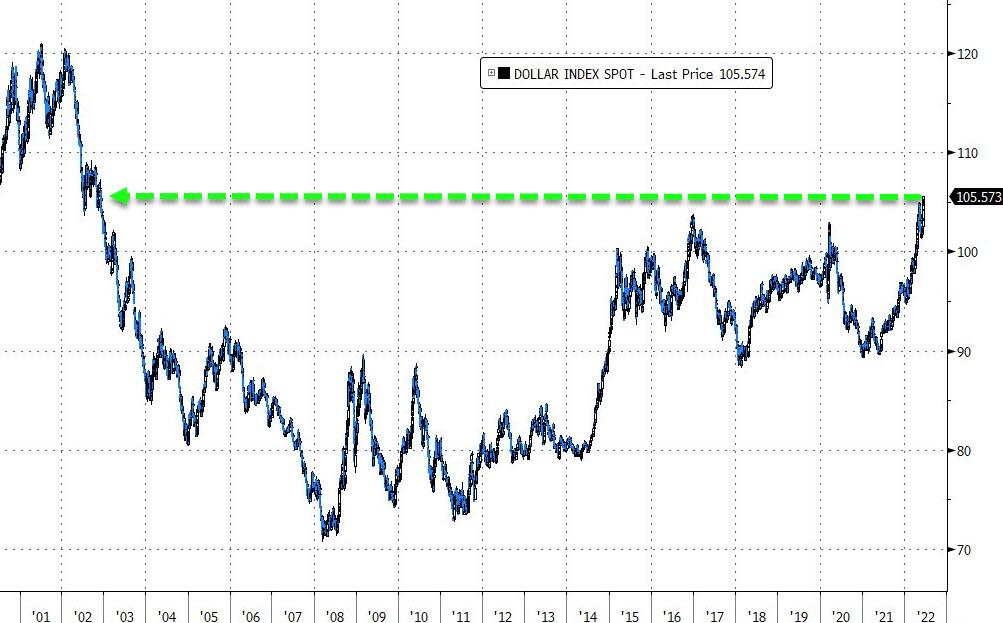
Bond yields were in rally mode with seemingly nothing being able to stop their advances. The 10-year surged above 3.47%, its highest level since 2011, according to ZH. That helped the US Dollar to add 0.37% for the day and reach a high last seen in late 2002.
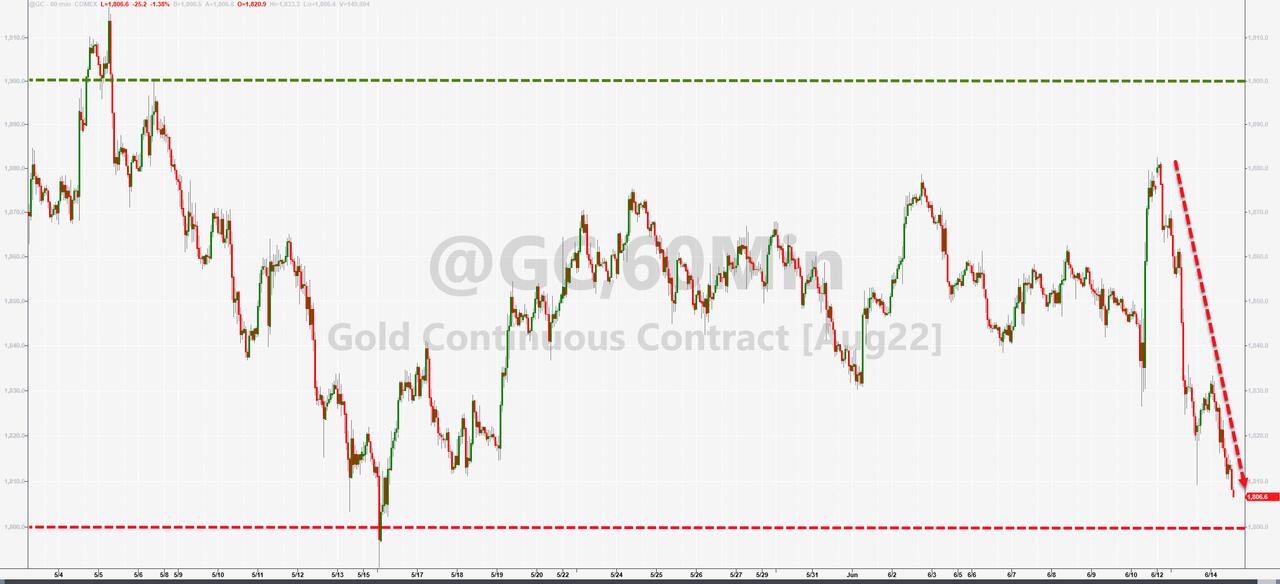
As is the case when the dollar rallies, gold suffers, and today was no exception, as the precious metal headed back down towards its $1,800 level.
All eyes are now on the Fed.
2. ETFs in the Spotlight
In case you missed the announcement and description of this section, you can read it here again.
It features some of the 10 broadly diversified domestic and sector ETFs from my HighVolume list as posted every Saturday. Furthermore, they are screened for the lowest MaxDD% number meaning they have been showing better resistance to temporary sell offs than all others over the past year.
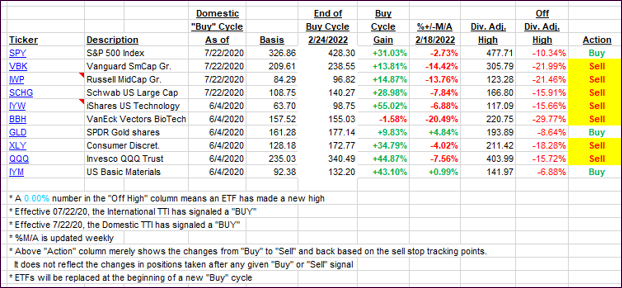
The below table simply demonstrates the magnitude with which these ETFs are fluctuating above or below their respective individual trend lines (%+/-M/A). A break below, represented by a negative number, shows weakness, while a break above, represented by a positive percentage, shows strength.
For hundreds of ETF choices, be sure to reference Thursday’s StatSheet.
For this closed-out domestic “Buy” cycle (2/24/2022), here’s how some of our candidates have fared:
Click image to enlarge.
Again, the %+/-M/A column above shows the position of the various ETFs in relation to their respective long-term trend lines, while the trailing sell stops are being tracked in the “Off High” column. The “Action” column will signal a “Sell” once the -12% point has been taken out in the “Off High” column, which has replaced the prior -8% to -10% limits.
3. Trend Tracking Indexes (TTIs)
Our TTIs slipped again with the overall market being floppy and choppy.
This is how we closed 06/14/2022:
Domestic TTI: -12.71% below its M/A (prior close -12.26%)—Sell signal effective 02/24/2022.
International TTI: -11.56% below its M/A (prior close -10.95%)—Sell signal effective 03/08/2022.
Disclosure: I am obliged to inform you that I, as well as my advisory clients, own some of the ETFs listed in the above table. Furthermore, they do not represent a specific investment recommendation for you, they merely show which ETFs from the universe I track are falling within the specified guidelines.
All linked charts above are courtesy of Bloomberg via ZeroHedge.
Contact Ulli