
- Moving the markets
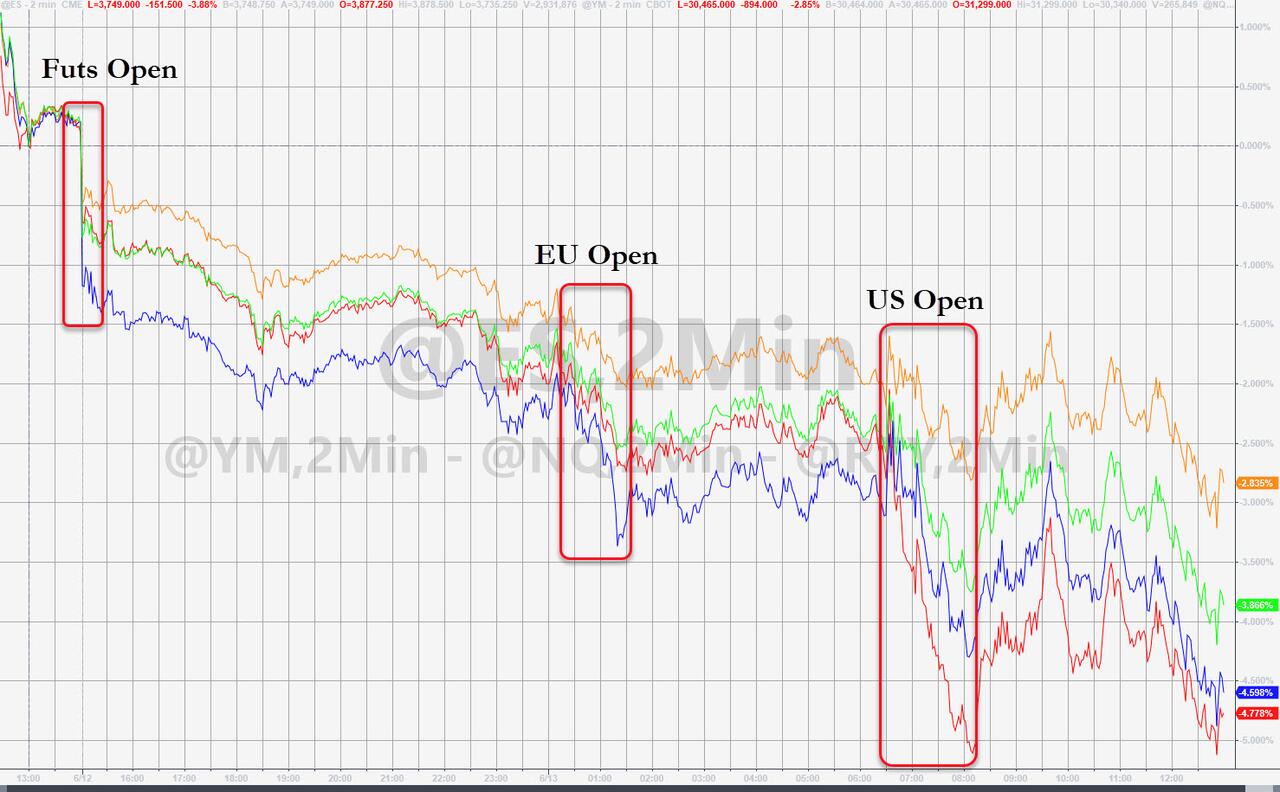
Friday’s drubbing was followed by an ugly overnight futures session, which already pointed towards another knock-down of the buy-and-hold crowd and the dip-buyers.
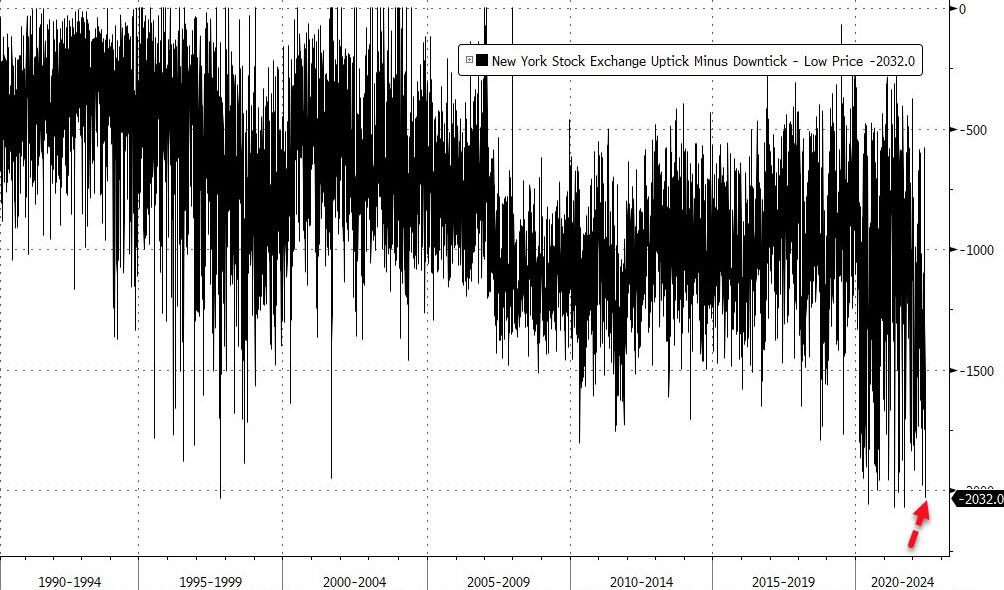
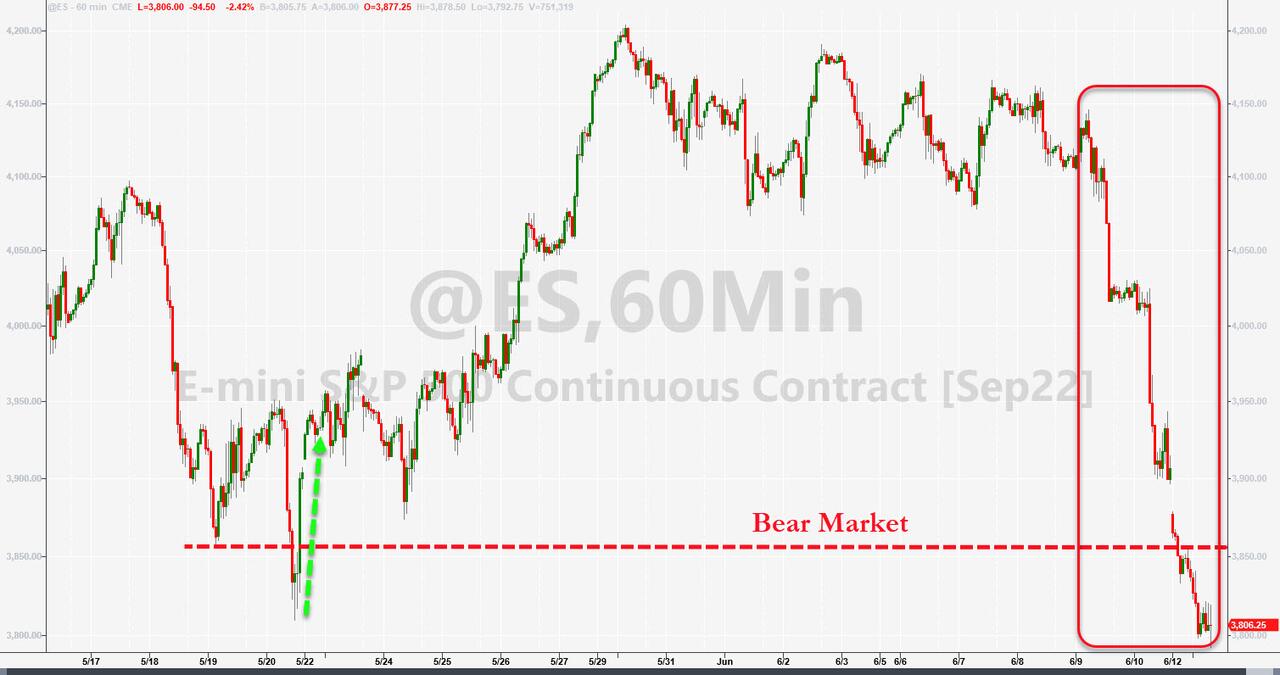
Things got worse as the fifth largest ‘sell program’ in history was launched, as ZeroHedge elaborated, and wreaked havoc with the markets, while sending the S&P 500 back into official Wall Street bear market territory, which the index had touched a few weeks ago.
It was a Puke-A-Thon at its finest with Bloomberg offering this explanation:
Sell programs of this size are typically no single events. They tend to happen in clusters, and that probably means stocks might be in store for bigger losses.
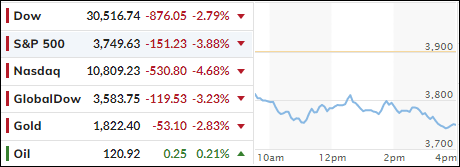
Bond yields surged, as the major indexes got clobbered with the S&P 500 losing almost 4%, but the Nasdaq fared worse by giving up 4.68%. The 10-year ripped higher by an amazing 22 basis points to close at 2.389%! For context, the 2-year has now reached its highest yield since 2008.
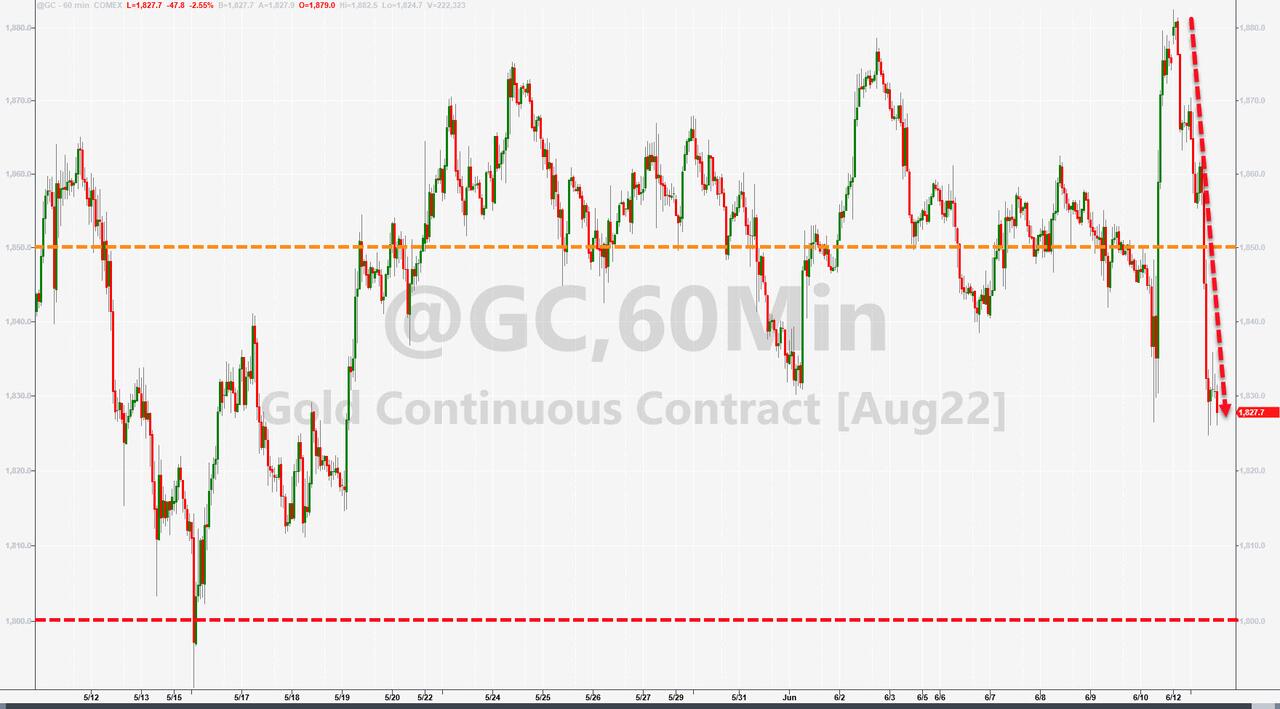
All asset classes were clubbed, and even gold could not escape the carnage, as a host of news combined to hand the bears a chest-pounding win. ZH noted that event risk anxiety ahead of the FOMC meeting combined with Option Expiration technicals ($3.4 trillion option expirations) and European ‘fragmentation’ fears, along with the usual political and economic worries, were simply too much for traders to handle.
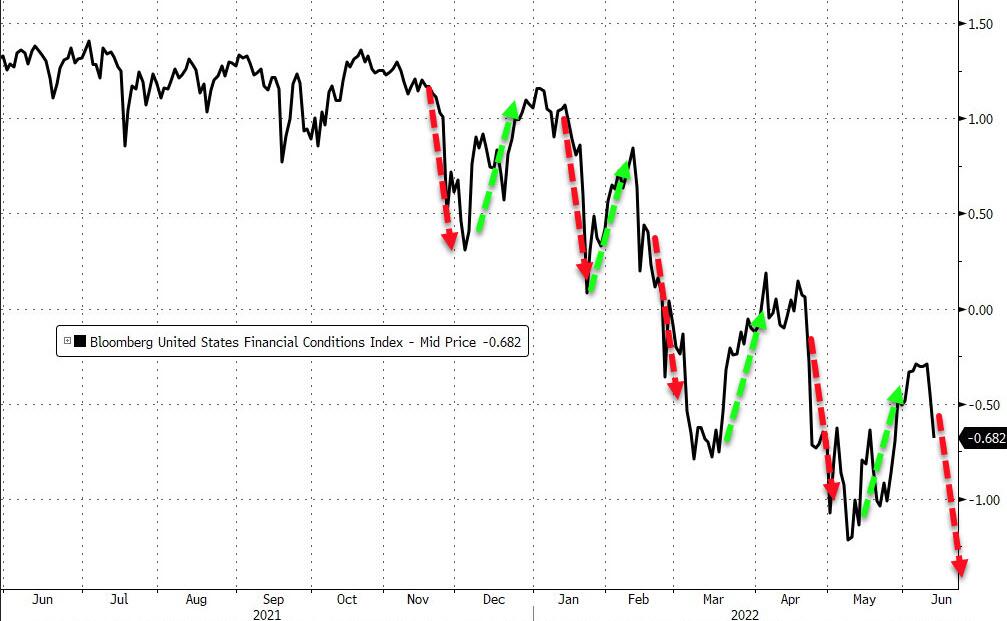
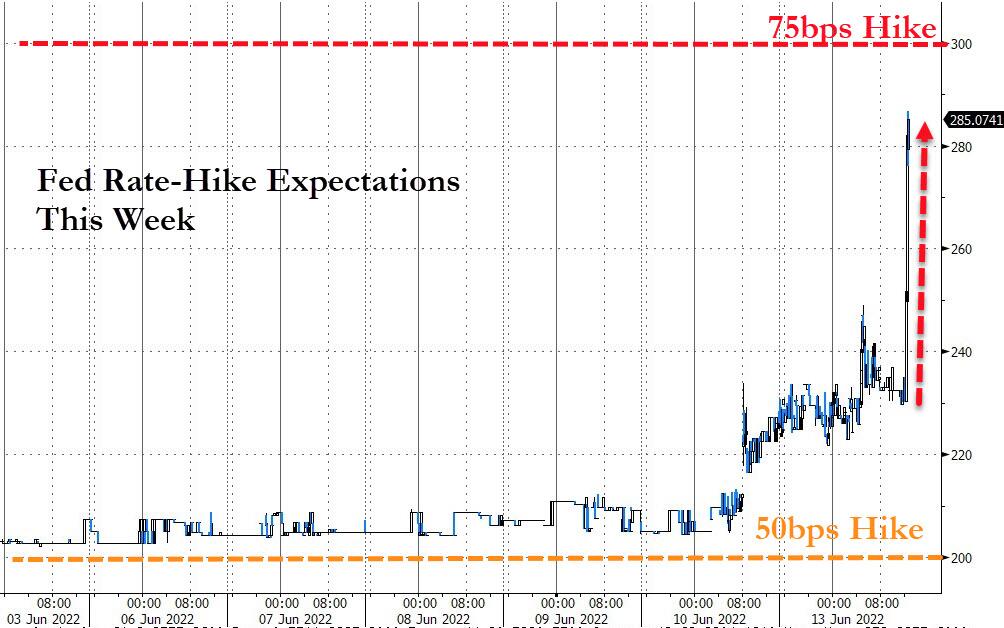
Financial conditions are tightening again and are zigzagging in tune with daily news as to the Fed’s next cause of action. This was not helped by sudden increase in expectations that the Fed might hike 75 bps instead of the assumed 50 bps when they meet this Wednesday.
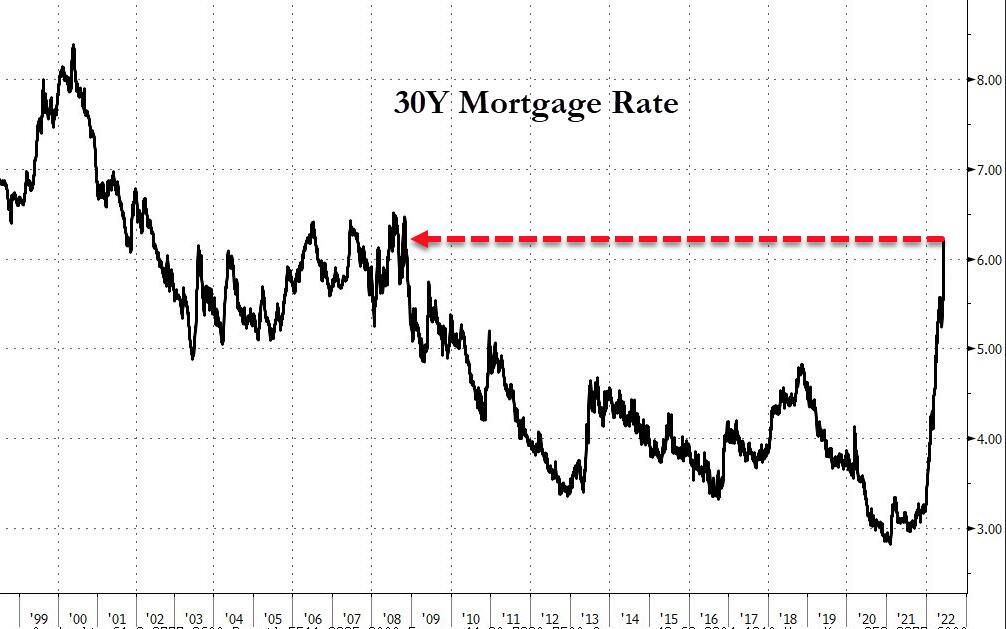
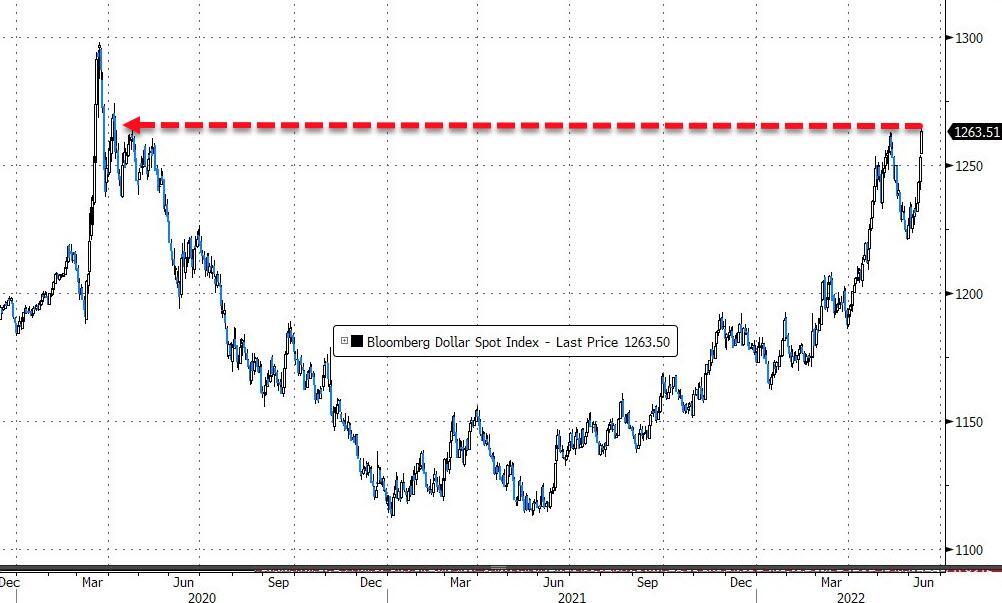
As a result of soaring bond yields, mortgage rates rose and topped 6%, the US Dollar reversed from its recent sell-off and raced higher, while gold suffered from higher rates and gave back its $1,850 level.
Even though, this bear market may present us with some bounce-backs, the major trend remains lower, and in my advisor practice, we continue to be out of equities but have some limited exposure in selected sector ETFs.
2. ETFs in the Spotlight
In case you missed the announcement and description of this section, you can read it here again.
It features some of the 10 broadly diversified domestic and sector ETFs from my HighVolume list as posted every Saturday. Furthermore, they are screened for the lowest MaxDD% number meaning they have been showing better resistance to temporary sell offs than all others over the past year.
The below table simply demonstrates the magnitude with which these ETFs are fluctuating above or below their respective individual trend lines (%+/-M/A). A break below, represented by a negative number, shows weakness, while a break above, represented by a positive percentage, shows strength.
For hundreds of ETF choices, be sure to reference Thursday’s StatSheet.
For this closed-out domestic “Buy” cycle (2/24/2022), here’s how some of our candidates have fared:
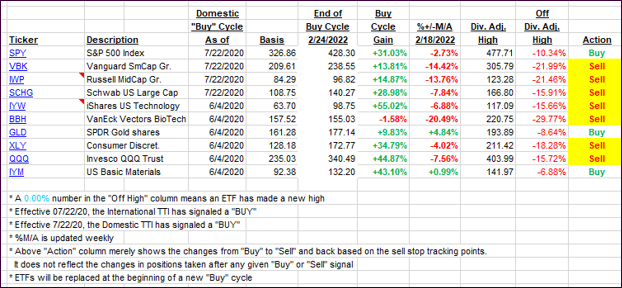
Click image to enlarge.
Again, the %+/-M/A column above shows the position of the various ETFs in relation to their respective long-term trend lines, while the trailing sell stops are being tracked in the “Off High” column. The “Action” column will signal a “Sell” once the -12% point has been taken out in the “Off High” column, which has replaced the prior -8% to -10% limits.
3. Trend Tracking Indexes (TTIs)
Our TTIs got absolutely crushed and dove deeper into bearish territory. It’s satisfying to watch this carnage from the sidelines with current activity reminding me of the destructive events of 2008.
This is how we closed 06/13/2022:
Domestic TTI: -12.26% below its M/A (prior close -8.58%)—Sell signal effective 02/24/2022.
International TTI: -10.95% below its M/A (prior close -8.07%)—Sell signal effective 03/08/2022.
Disclosure: I am obliged to inform you that I, as well as my advisory clients, own some of the ETFs listed in the above table. Furthermore, they do not represent a specific investment recommendation for you, they merely show which ETFs from the universe I track are falling within the specified guidelines.
All linked charts above are courtesy of Bloomberg via ZeroHedge.
Contact Ulli