
- Moving the markets
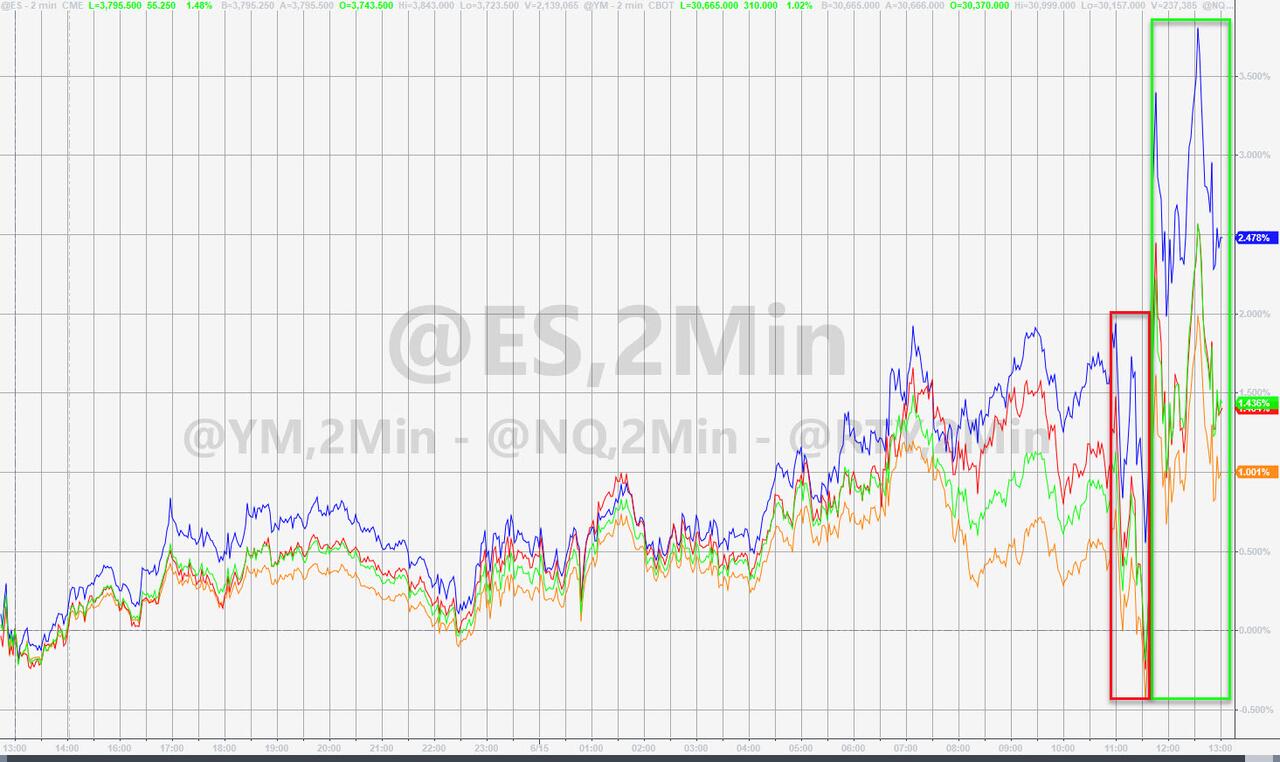
The much-anticipated Fed announcement came and went, with the Fed hiking rates by 75 basis points, its largest increase since 1994. They also hinted at a similar increase in July, which indicated some seriousness about its inflation fighting efforts, but it also caught traders of guard.
It’s been no secret that the Fed’s policy has been out of sync with inflation realities, so today’s aggressive stance pleased the markets—at least for the time being. The question remains whether the Fed is now hiking rates into a recession.
So far, the answer is “very likely,” as the Atlanta Fed slashed its Q2 forecast to 0.00% from the recent 0.9%, which means the US is on the verge of a technical recession after Q1’s contraction, as ZeroHedge called it.
Yet, Fed head Powell had this to say:
The US economy is in a strong position and well positioned to deal with higher interest rates.
There is no sign of a broader slowdown in the economy that I can see.
Hmm, I am sure that Powell will have eat these words eventually, in the same way he had to walk back the “inflation is transitory” scheme.
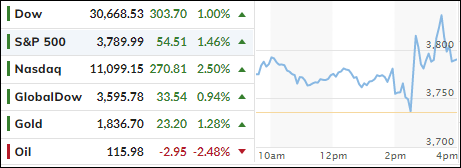
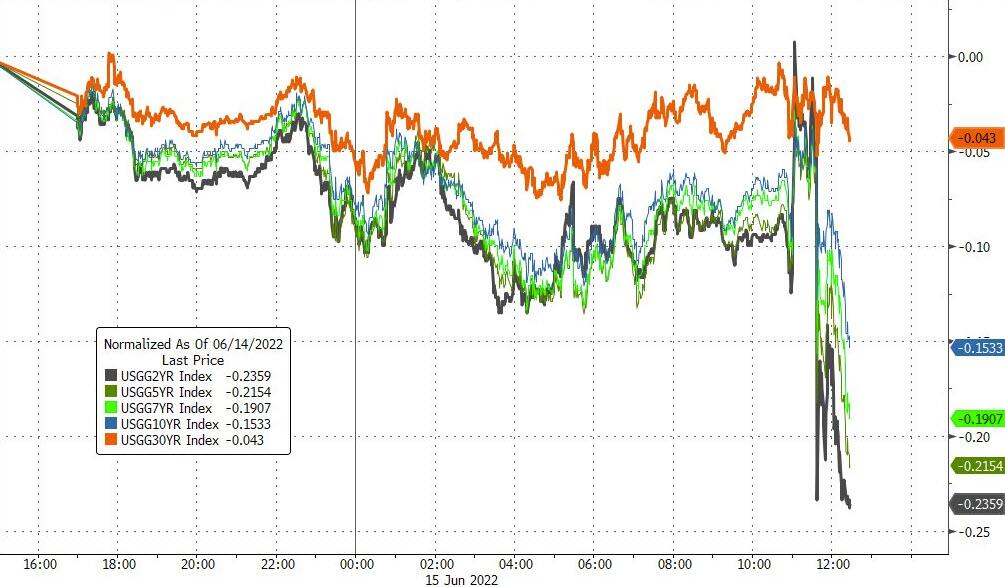
The markets took it all as a bullish sign, and after the recent drubbing managed to string together a green close. Sliding bond yields helped, with the 10-year dropping some 16 bps to close at 3.31%.
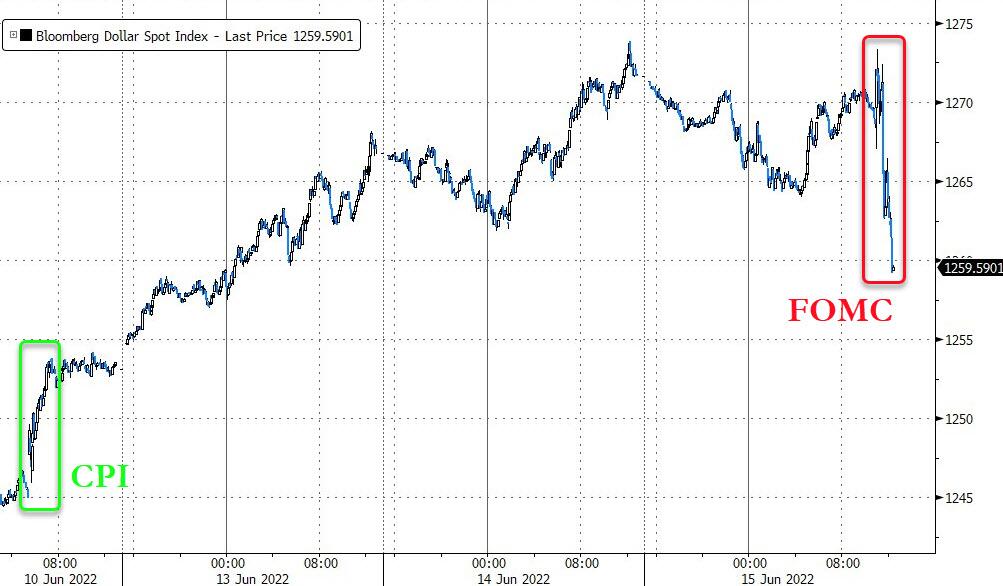
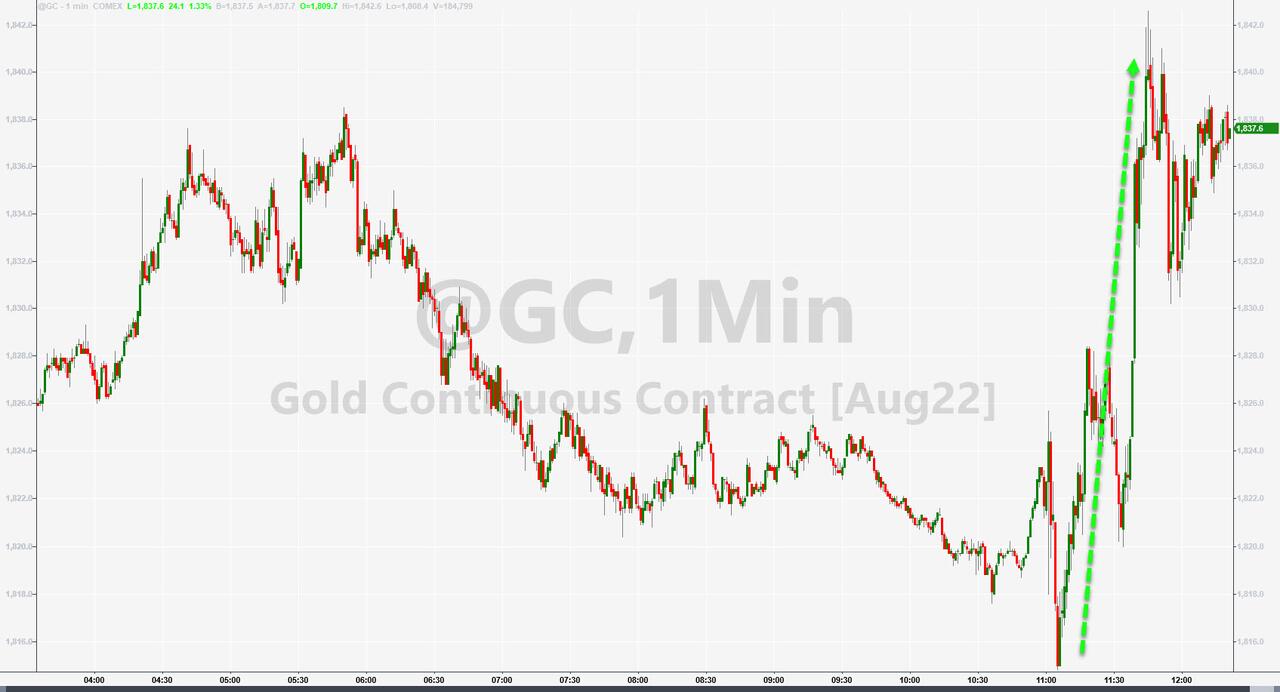
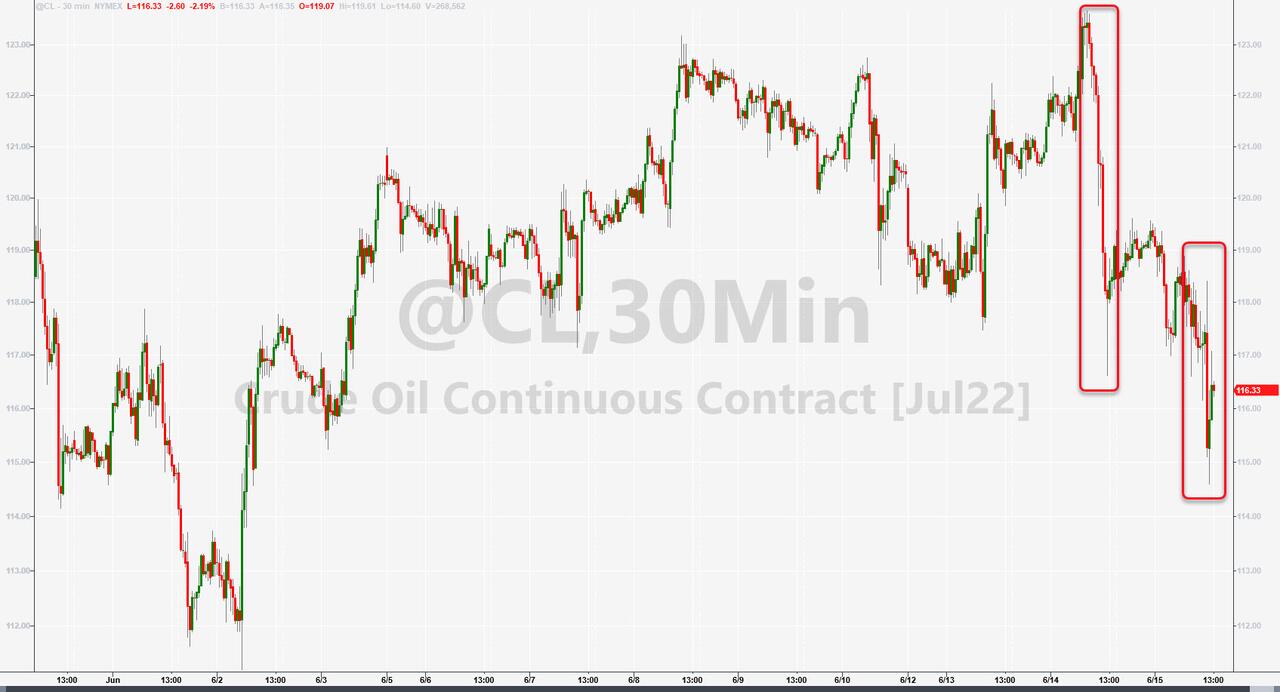
That downward action caused the US Dollar to puke and surrender some of its recent gains. The beneficiary was gold, which stormed out of the gate and ripped higher by +1.3%, while Crude Oil extended its recent losses.
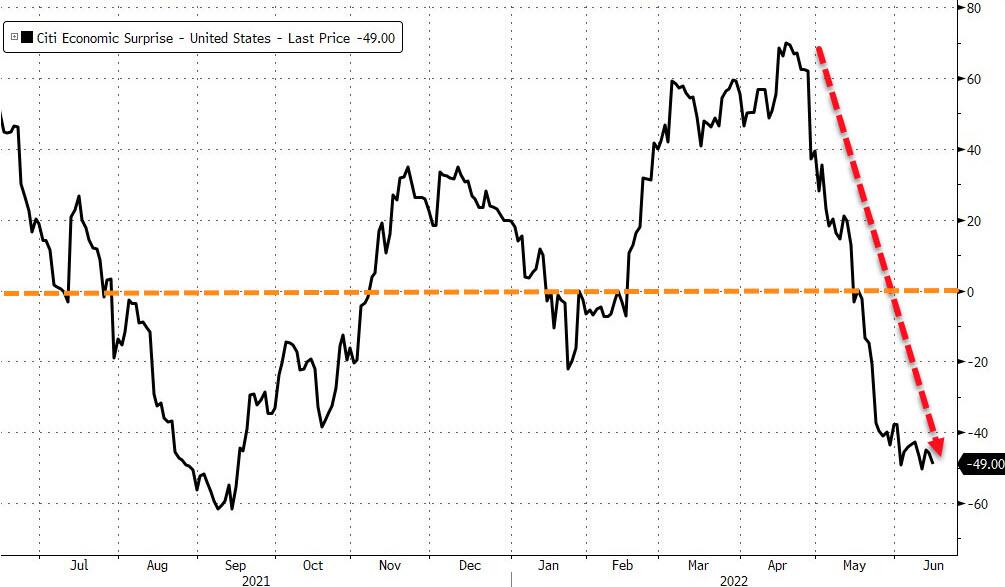
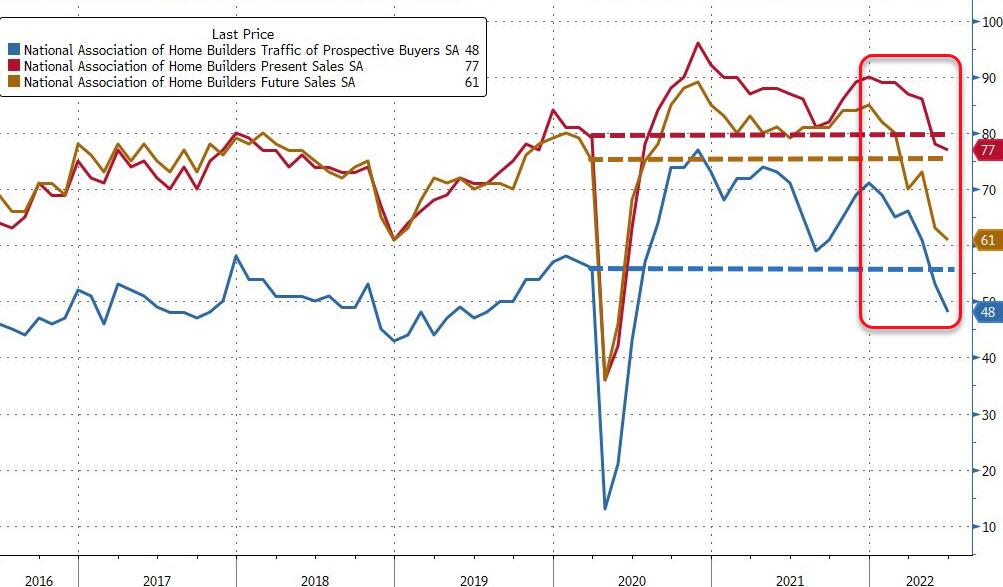
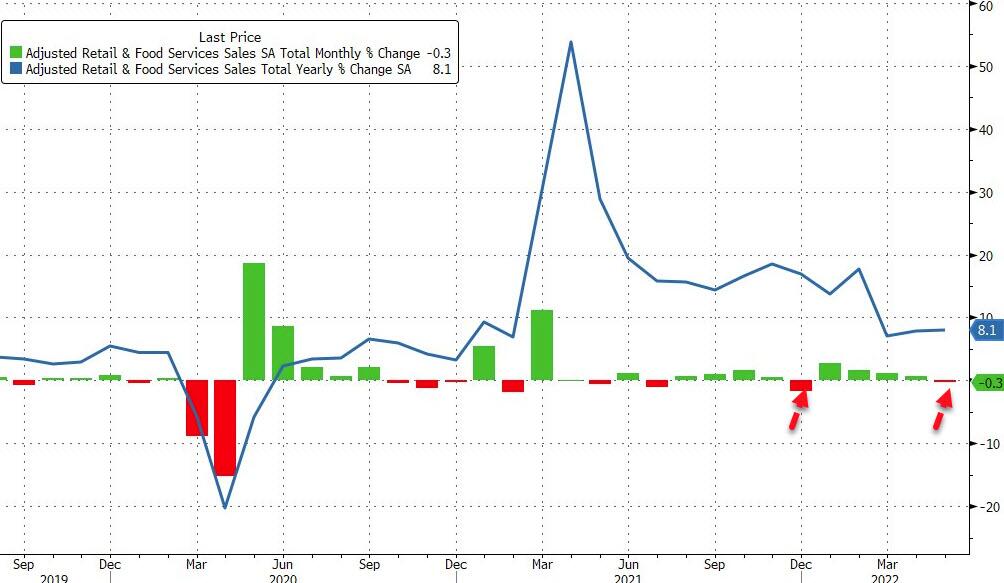
In economic news, Homebuilder Sentiment tumbled back below pre-Covid levels, as ZH pointed out, and US Retail Sales unexpectedly tumbled in May and showed its first negative print since December 2021.
All this simply shows that the likelihood of “Stagflation” being in our future seems to increase on a daily basis.
2. ETFs in the Spotlight
In case you missed the announcement and description of this section, you can read it here again.
It features some of the 10 broadly diversified domestic and sector ETFs from my HighVolume list as posted every Saturday. Furthermore, they are screened for the lowest MaxDD% number meaning they have been showing better resistance to temporary sell offs than all others over the past year.
The below table simply demonstrates the magnitude with which these ETFs are fluctuating above or below their respective individual trend lines (%+/-M/A). A break below, represented by a negative number, shows weakness, while a break above, represented by a positive percentage, shows strength.
For hundreds of ETF choices, be sure to reference Thursday’s StatSheet.
For this closed-out domestic “Buy” cycle (2/24/2022), here’s how some of our candidates have fared:

Click image to enlarge.
Again, the %+/-M/A column above shows the position of the various ETFs in relation to their respective long-term trend lines, while the trailing sell stops are being tracked in the “Off High” column. The “Action” column will signal a “Sell” once the -12% point has been taken out in the “Off High” column, which has replaced the prior -8% to -10% limits.
3. Trend Tracking Indexes (TTIs)
Our TTIs gained a little bit of ground, as the Fed decision was digested with a sense of relief.
This is how we closed 06/15/2022:
Domestic TTI: -11.88% below its M/A (prior close -12.71%)—Sell signal effective 02/24/2022.
International TTI: -10.67% below its M/A (prior close -11.56%)—Sell signal effective 03/08/2022.
Disclosure: I am obliged to inform you that I, as well as my advisory clients, own some of the ETFs listed in the above table. Furthermore, they do not represent a specific investment recommendation for you, they merely show which ETFs from the universe I track are falling within the specified guidelines.
All linked charts above are courtesy of Bloomberg via ZeroHedge.
Contact Ulli