
- Moving the markets
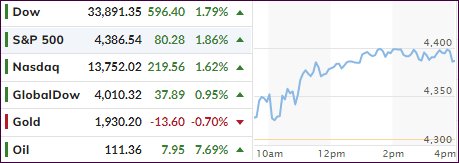
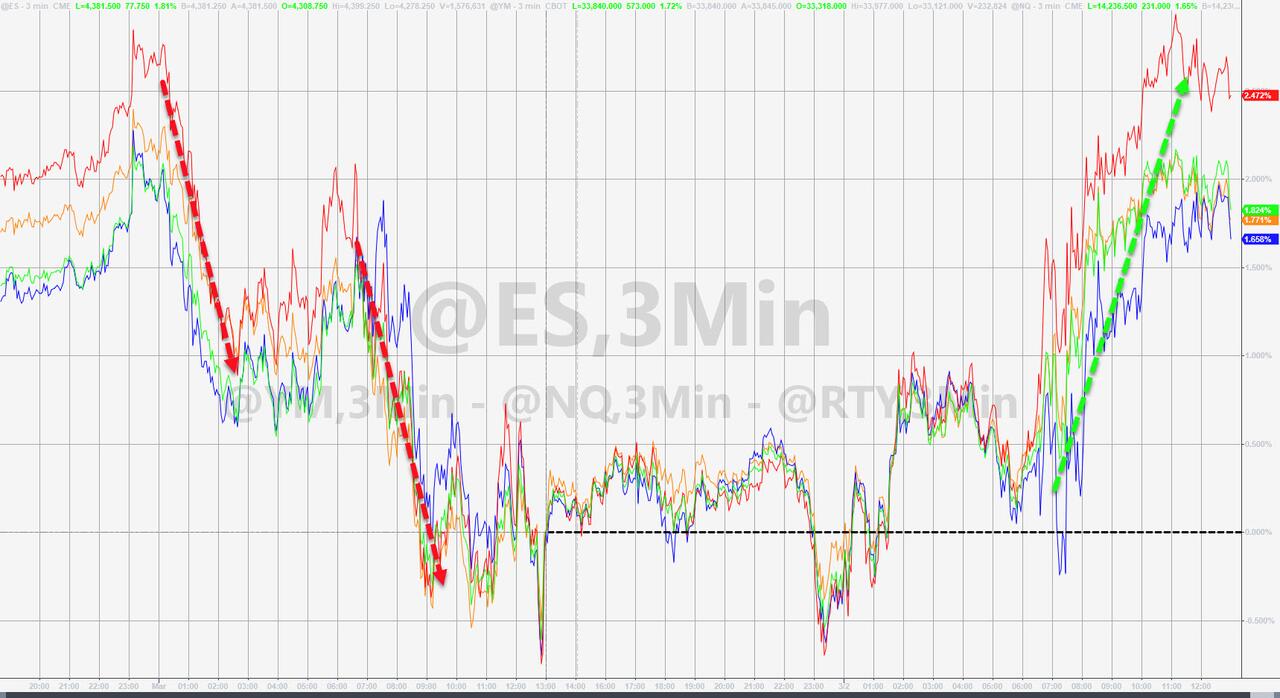
The bulls tried to shake off the effects of the Ukraine-Russia confrontation and managed to squeeze out a rebound, despite surging oil and commodity prices. While the major indexes recovered yesterday’s losses, today’s action had the smell of a dead cat bounce.
Sure, there were several verbal assists helping market sentiment starting with Biden’s request last night for the Fed to address inflation. This morning, as if on cue, Fed head Powell said that he is “inclined to support a 25-basis point rate hike,” which will do nothing to fight inflation but helped the bulls to drive up equities, because the much-feared 50-basis point hike had now been moved to the back burner.
While headline news about the Eastern European war were conflicting, positive remarks from both sides of a possible reduction of hostilities and scheduled talks also added confidence to the bullish meme. Today was all about relief and that’s what provided the impetus for the rally.
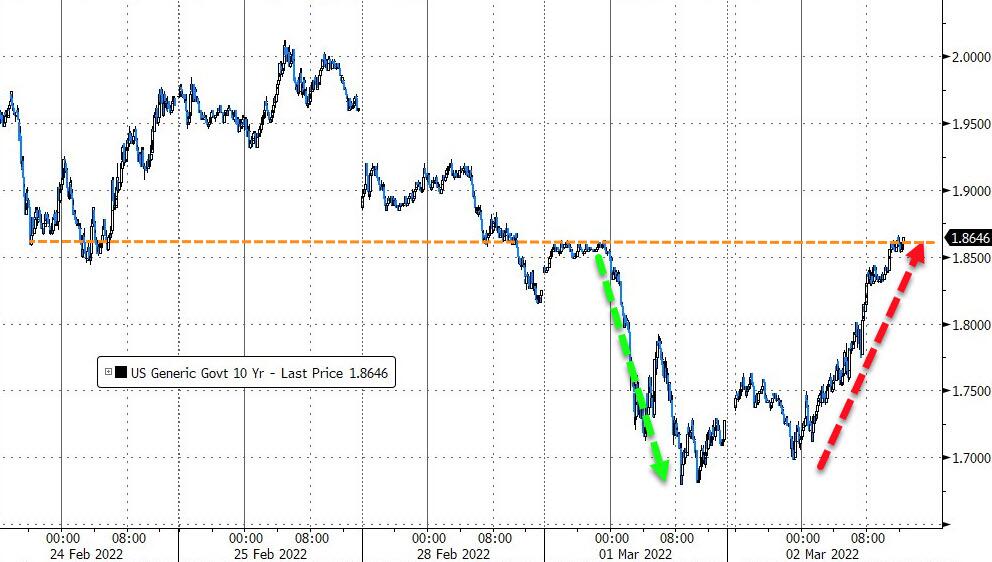
A huge spike in bond yields should have kept any equity advances at bay, but it did not. The 10-year surged over 16 bps to 1.886%, a huge move by any standards, but it goes to show the insanity in the market place and the “mad world” we are living in.
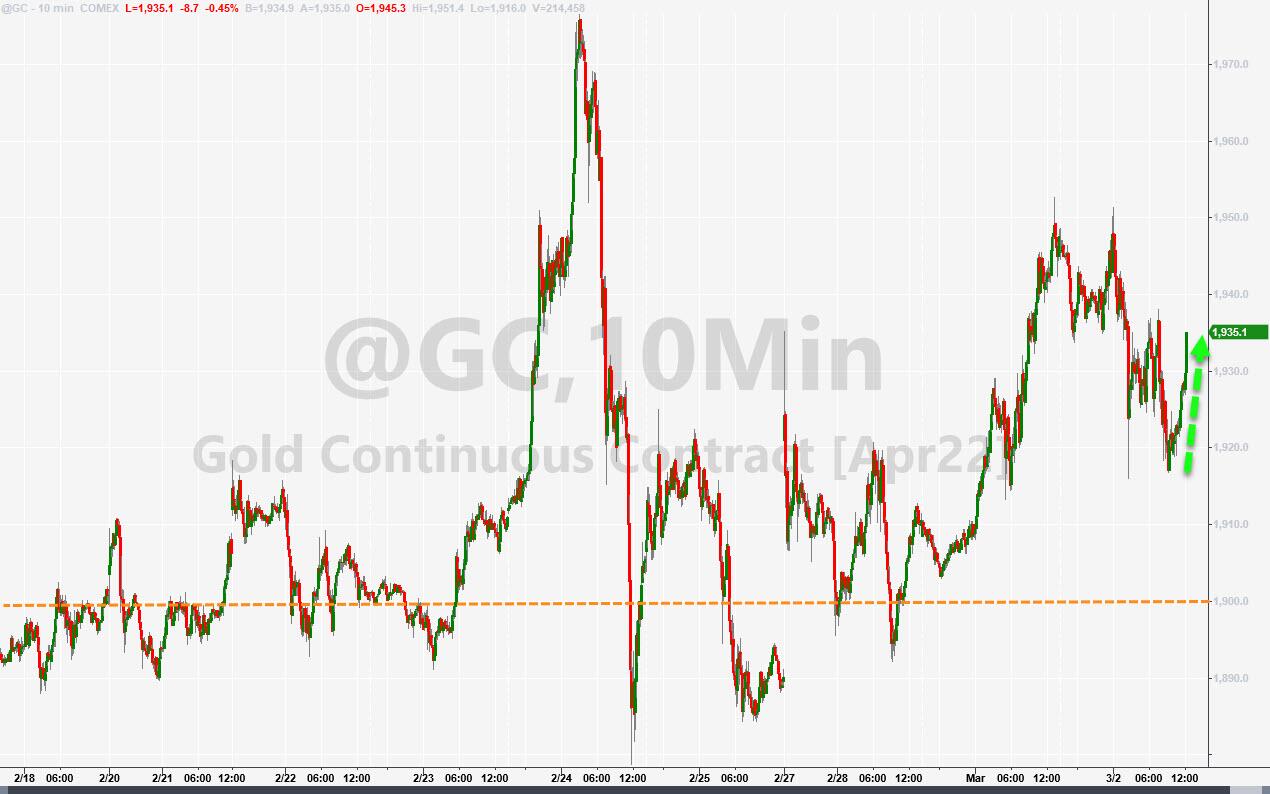
The US Dollar dipped and so did gold, with the precious taking a breather from its recent runup. But crude oil kept soaring and closed at $111, solidly above the $100 glass ceiling.
As I pointed out many times, during the initial inflationary stages, and higher rates, stocks will benefit temporarily, but later that sentiment will change.
Former bond king Bill Gross seems to have a similar view:
“Stocks and even bonds can thrive with low-to-mild future inflation,” the billionaire wrote. “But anything beyond 3% and higher” is market-threatening. “Don’t get too excited.”
2. ETFs in the Spotlight
In case you missed the announcement and description of this section, you can read it here again.
It features some of the 10 broadly diversified domestic and sector ETFs from my HighVolume list as posted every Saturday. Furthermore, they are screened for the lowest MaxDD% number meaning they have been showing better resistance to temporary sell offs than all others over the past year.
The below table simply demonstrates the magnitude with which these ETFs are fluctuating above or below their respective individual trend lines (%+/-M/A). A break below, represented by a negative number, shows weakness, while a break above, represented by a positive percentage, shows strength.
For hundreds of ETF choices, be sure to reference Thursday’s StatSheet.
For this just closed-out domestic “Buy” cycle, here’s how some of our candidates have fared:
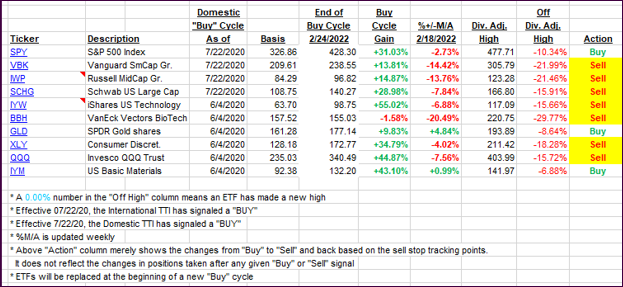
Click image to enlarge.
Again, the %+/-M/A column above shows the position of the various ETFs in relation to their respective long-term trend lines, while the trailing sell stops are being tracked in the “Off High” column. The “Action” column will signal a “Sell” once the -12% point has been taken out in the “Off High” column, which has replaced the prior -8% to -10% limits.
3. Trend Tracking Indexes (TTIs)
Both TTIs rallied with the Domestic one crossing back above its trend line by the tiniest of margins, which did not affect our major trend direction.
This is how we closed 03/02/2022:
Domestic TTI: +0.08% above its M/A (prior close -2.01%)—Sell signal effective 02/24/2022.
International TTI: -1.46% below its M/A (prior close -2.45%)—Buy signal effective 07/22/2020.
Disclosure: I am obliged to inform you that I, as well as my advisory clients, own some of the ETFs listed in the above table. Furthermore, they do not represent a specific investment recommendation for you, they merely show which ETFs from the universe I track are falling within the specified guidelines.
All linked charts above are courtesy of Bloomberg via ZeroHedge.
Contact Ulli