
- Moving the markets
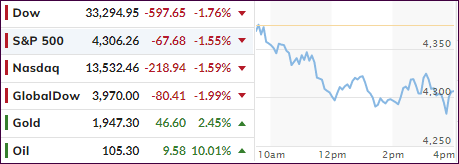
As the Russia-Ukraine conflict spreads and intensifies, it should come as no surprise that equities eventually would be affected negatively. We have seen some late session comeback attempts, but current geopolitical conditions may make it very difficult to continue these efforts.
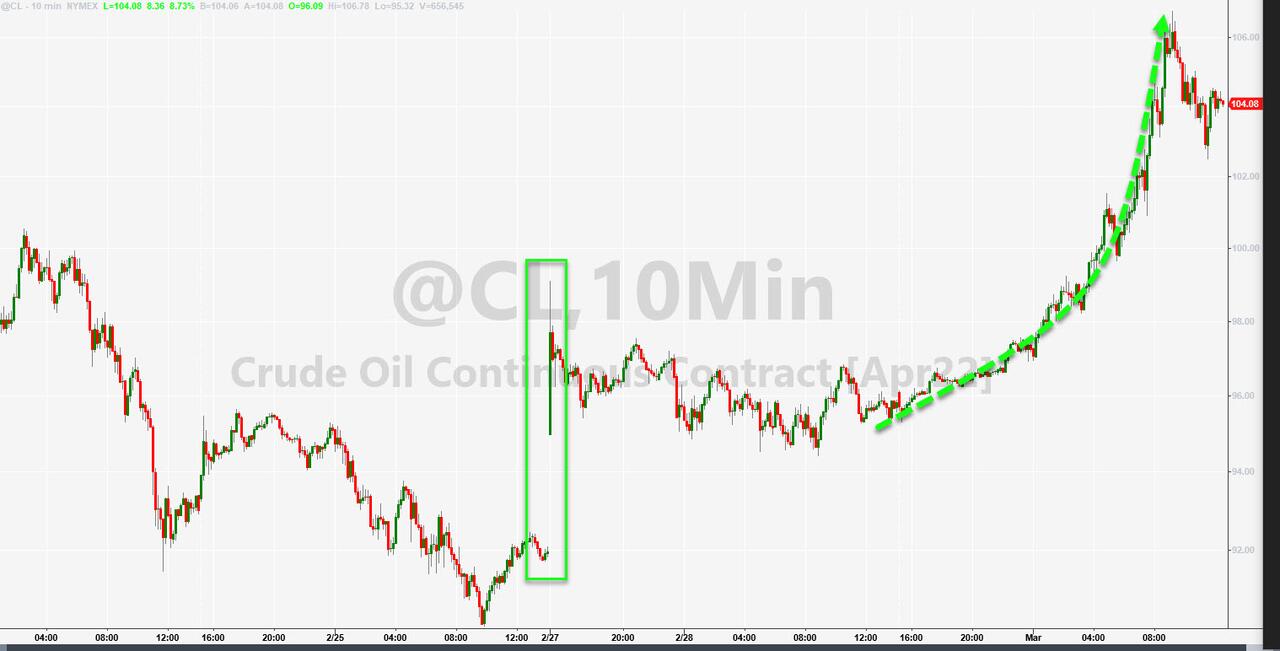
The reality, that sanctioning others may have a boomerang effect came into play today, when crude oil surged over to $100, making future gasoline price hikes at the pump a virtual certainty. Commodities rallied in sync, with my favorite index (DBC), which we own, spiking 4% on the day.
With our domestic Trend Tracking Index (TTI-section 3 below) diving deeper into bear market territory, equities seem to be stuck in a fog of uncertainty and lack incentive to stabilize—at least for the time being.
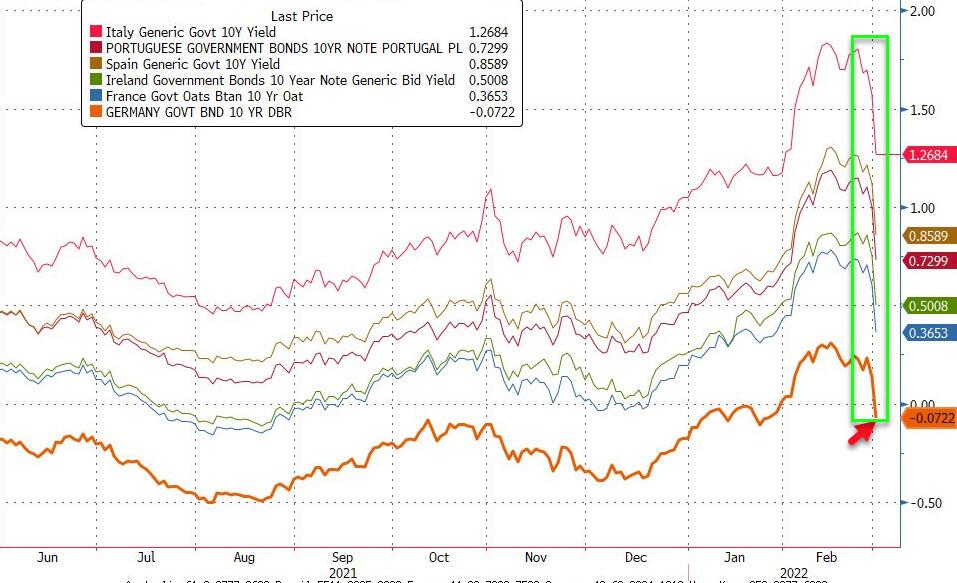
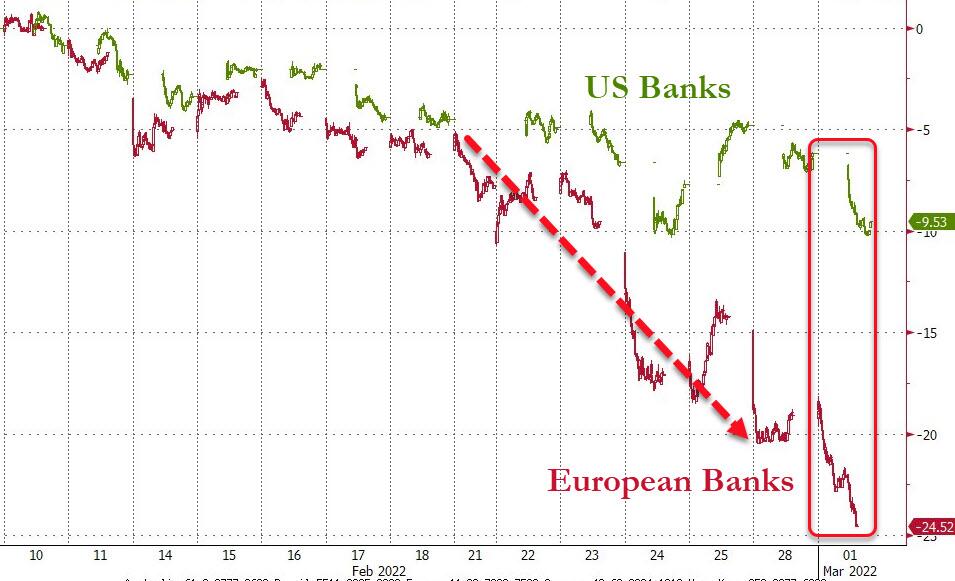
Bond yields around the world crashed, with some having their biggest drops since 1992 (UK-10-year). While US banks were the worst performers today, their European cousins were in much worse shape, down some 25% in the last few days, as Bloomberg shows here.
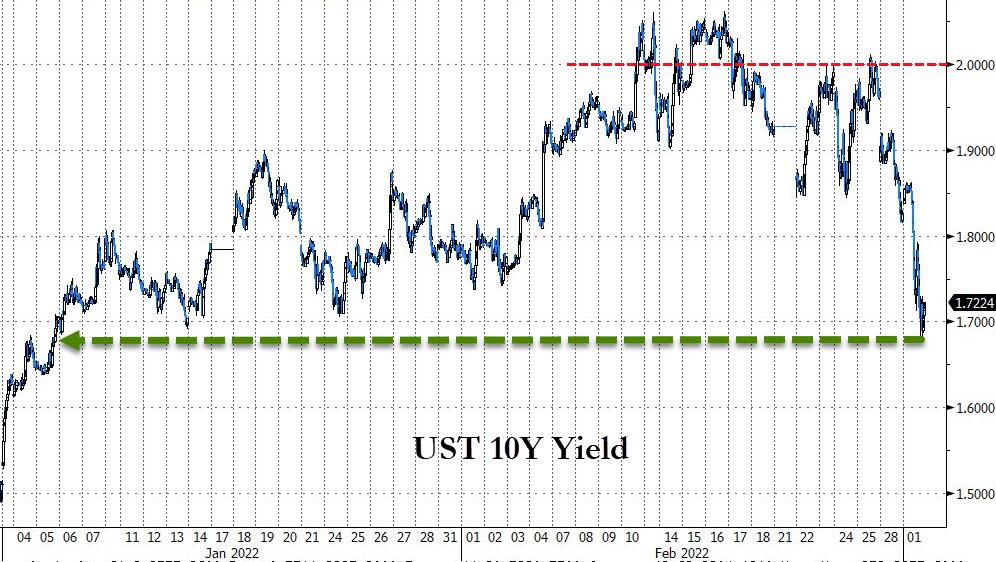
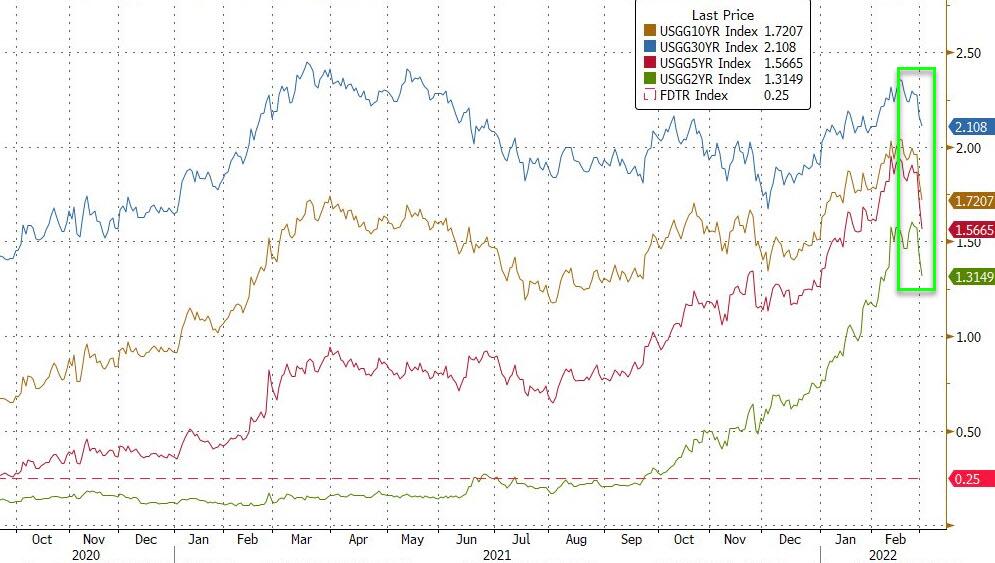
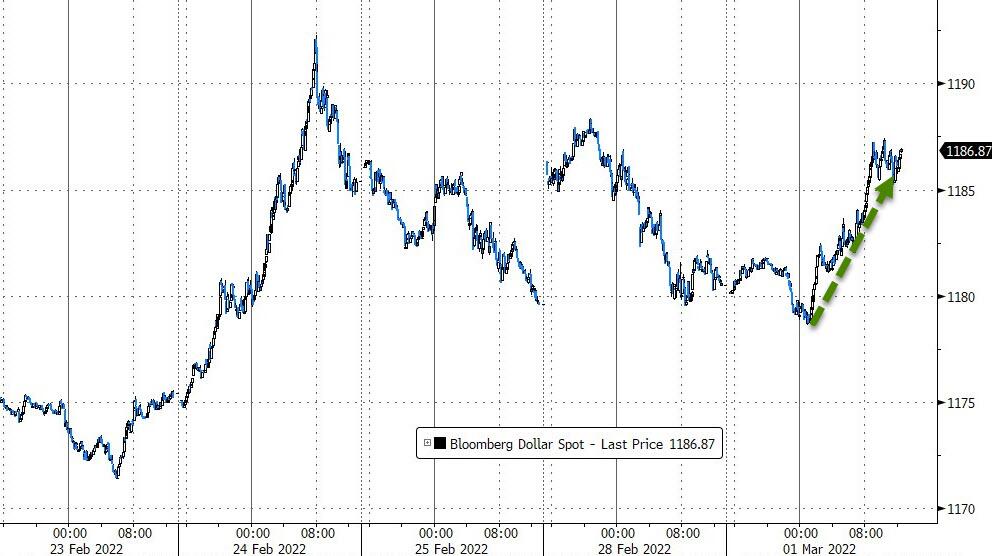
Here at home, the 10-year yield tumbled to below 1.7%, a level last seen at the beginning of January. All other maturities showed similar performances. With the flight to safety on traders’ minds, the US Dollar rebounded and closed higher.
Gold did what it’s supposed to, namely rally during times of uncertainty, and the precious metal did not disappoint, as it surged +2.57% for the session.
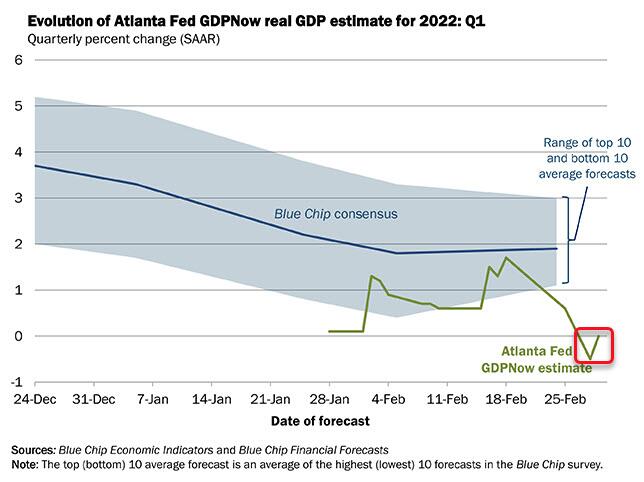
Among all this upheaval, the Atlanta Fed announced their GDP estimate for Q1 2022. I hate to be the bearer of bad news, but the number they spewed out was a big fat ZERO. In other words, no growth, and when coupling this with the inflationary trends we’re seeing, it appears to me that “Stagflation” is now firmly baked into the cake.
2. ETFs in the Spotlight
In case you missed the announcement and description of this section, you can read it here again.
It features some of the 10 broadly diversified domestic and sector ETFs from my HighVolume list as posted every Saturday. Furthermore, they are screened for the lowest MaxDD% number meaning they have been showing better resistance to temporary sell offs than all others over the past year.
The below table simply demonstrates the magnitude with which these ETFs are fluctuating above or below their respective individual trend lines (%+/-M/A). A break below, represented by a negative number, shows weakness, while a break above, represented by a positive percentage, shows strength.
For hundreds of ETF choices, be sure to reference Thursday’s StatSheet.
For this just closed-out domestic “Buy” cycle, here’s how some of our candidates have fared:
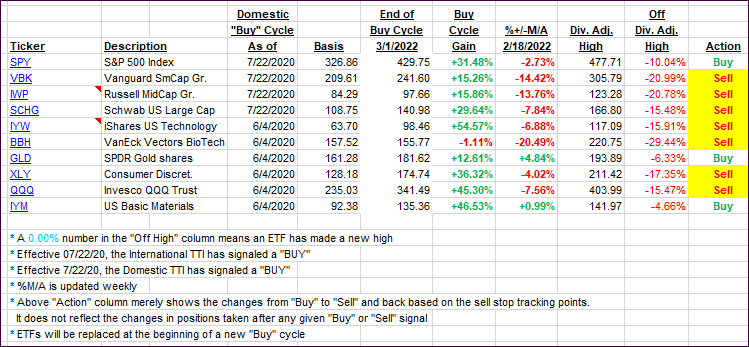
Click image to enlarge.
Again, the %+/-M/A column above shows the position of the various ETFs in relation to their respective long-term trend lines, while the trailing sell stops are being tracked in the “Off High” column. The “Action” column will signal a “Sell” once the -12% point has been taken out in the “Off High” column, which has replaced the prior -8% to -10% limits.
3. Trend Tracking Indexes (TTIs)
Both of our TTIs dropped deeper into bearish territory with the International one needing another drop for me to announce the end of that “Buy” cycle as well. It has no impact in my advisory business, since we don’t have any international positions.
This is how we closed 03/01/2022:
Domestic TTI: -2.01% below its M/A (prior close -0.30%)—Sell signal effective 02/24/2022.
International TTI: -2.45% below its M/A (prior close -0.47%)—Buy signal effective 07/22/2020.
Disclosure: I am obliged to inform you that I, as well as my advisory clients, own some of the ETFs listed in the above table. Furthermore, they do not represent a specific investment recommendation for you, they merely show which ETFs from the universe I track are falling within the specified guidelines.
All linked charts above are courtesy of Bloomberg via ZeroHedge.
Contact Ulli