
- Moving the markets
Volatility reigned supreme in the markets, but in the end, this session did not turn out as bad as had been feared over the weekend. With the Russia-Ukraine war heating up and sanctions being announced around the world, there will be more fallout ahead for all parties involved.
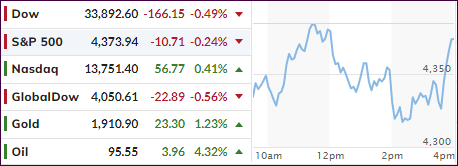
After being down some 500 points early on, the Dow, along with the other two major indexes, roundtripped yet managed to find a bottom late in the session, which turned into catalyst for digging themselves out of a deep hole.
As a result, we only closed moderately in the red with the Nasdaq eking out a 0.41% gain, after having been down over 3% in the overnight session. February, however, was a rough one for stocks with all indexes posting sharp monthly losses.
ZH summed up February like this:
It’s almost difficult to remember now, but February started with a lingering focus on the Omicron wave of the virus and the expected business interruptions that COVID was again causing. The virus has since faded in the US although it still has a very real presence in Asia.
The realization that inflation does not appear to be temporary and may be more persistent than recent past bouts of higher prices has also caused markets to increase expectations for the number of rate hikes that the Fed is likely to initiate in the imminent hiking cycle.
And as we exit February, Goldman’s Chris Hussey notes that attention is now divided between what the Fed will say (and do) on March 16th and how the situation between Russia and Ukraine will evolve. Against this backdrop of rising inflation, rates, and geopolitical risk, Energy and Materials outperformed again in February.
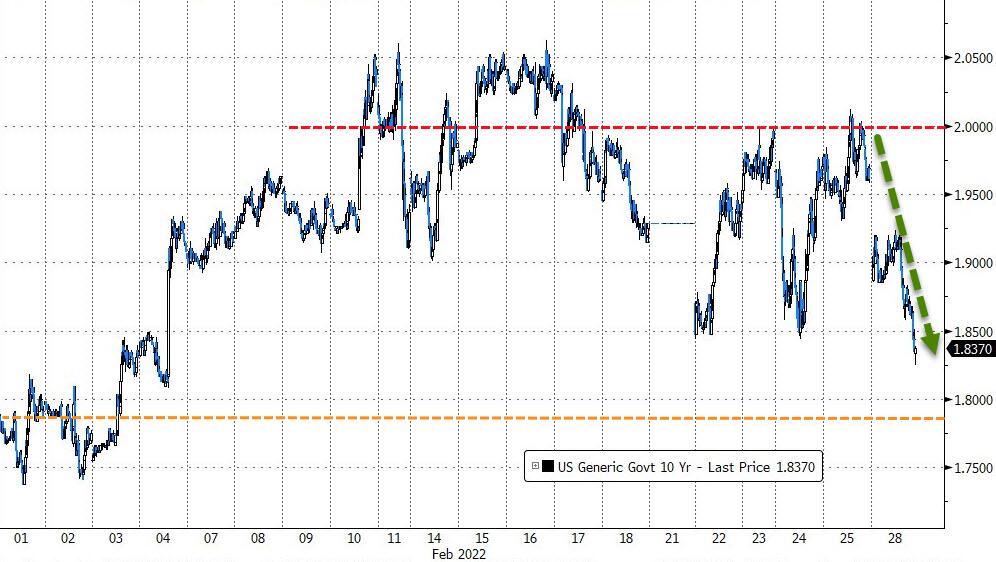
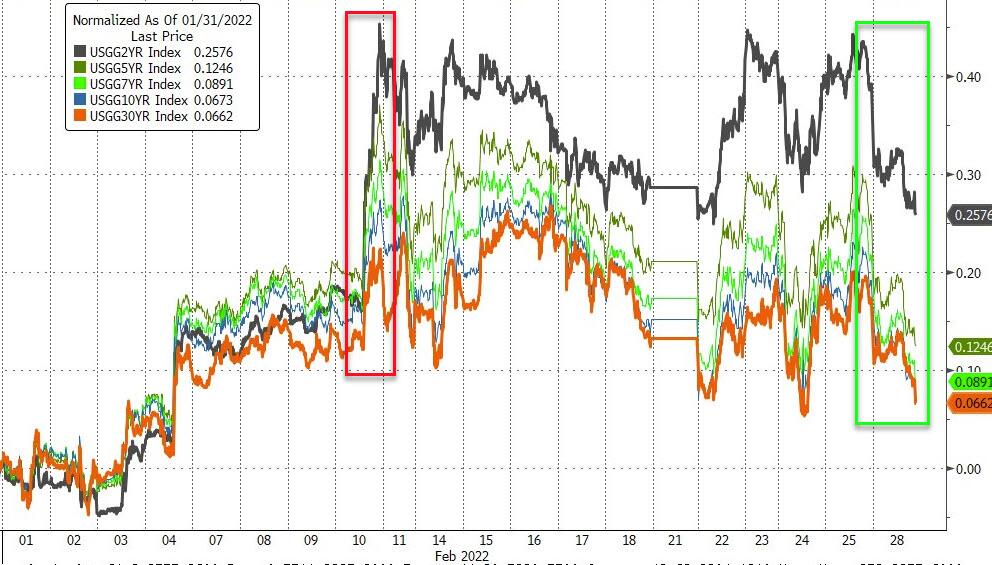
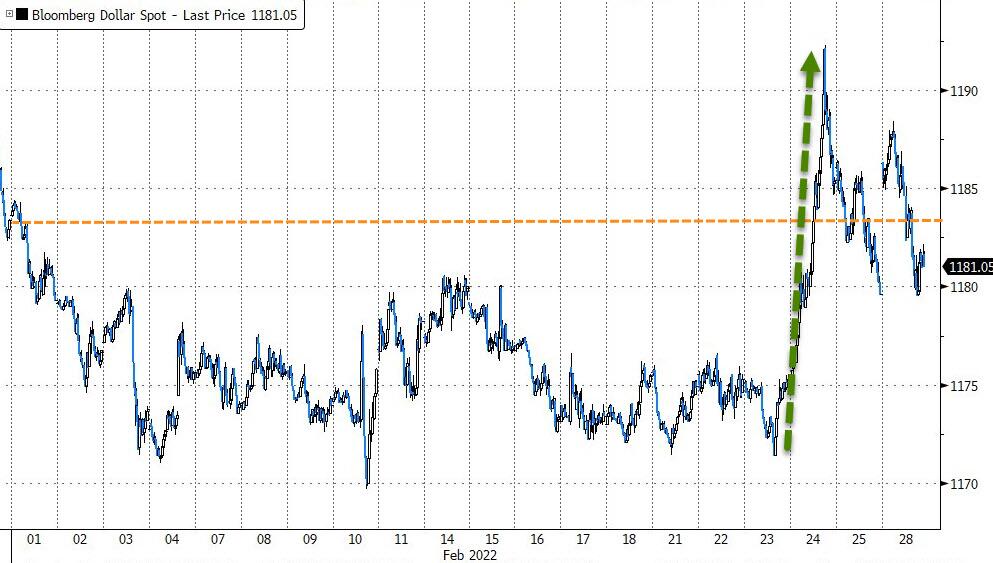
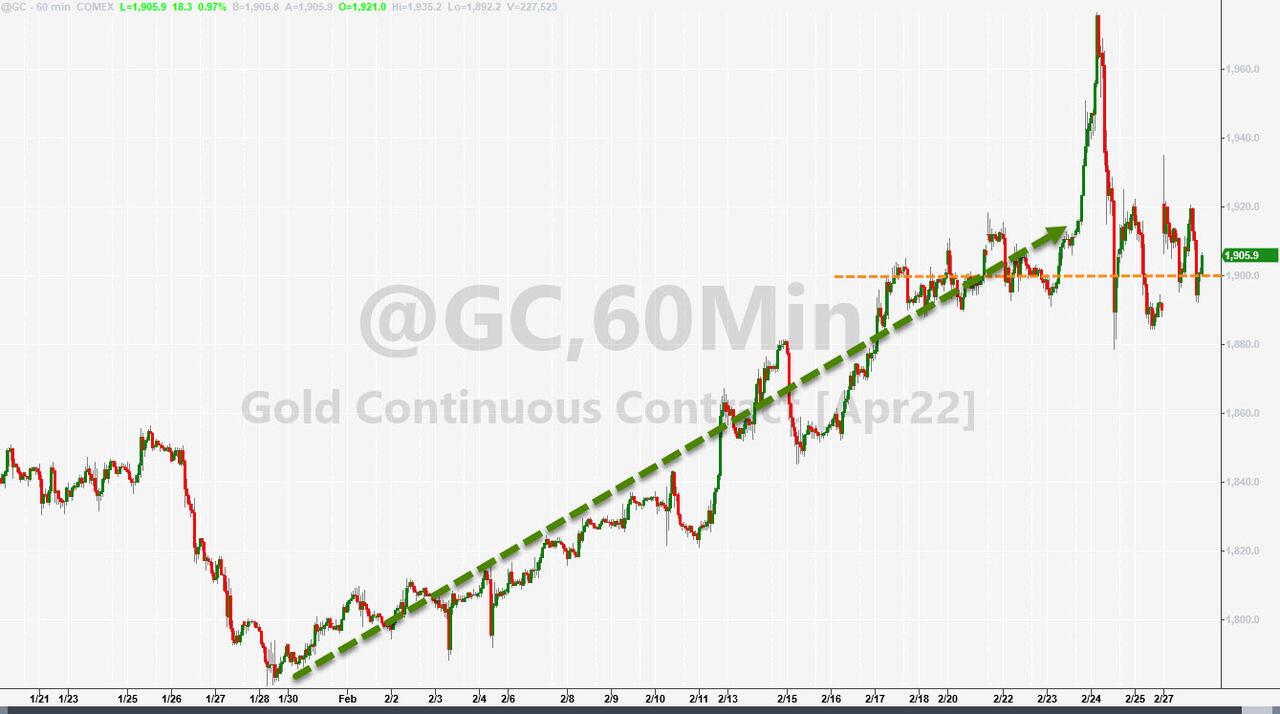
As could be expected, during times of turbulence, bonds benefited today as yields retreated with the 10-year pulling back to 1.82%, but for the month, all yields were higher. The US Dollar dropped today and ended the month moderately lower, while gold successfully defended its $1,900 level.
Any kind of “war” presents a “risk off” environment, during which reduced exposure and/or flight into those sectors benefitting from the current situation, is a sensible way to go.
Everything we are currently witnessing is simply unprecedented and predictions are merely wild guesses likely influenced by wishful thinking.
We are facing many unknowns, and a more conservative approach to investing with less exposure will better protect our portfolios, should the unknowns increase in magnitude and pull equities deeper into bear market territory.
2. ETFs in the Spotlight
In case you missed the announcement and description of this section, you can read it here again.
It features some of the 10 broadly diversified domestic and sector ETFs from my HighVolume list as posted every Saturday. Furthermore, they are screened for the lowest MaxDD% number meaning they have been showing better resistance to temporary sell offs than all others over the past year.
The below table simply demonstrates the magnitude with which these ETFs are fluctuating above or below their respective individual trend lines (%+/-M/A). A break below, represented by a negative number, shows weakness, while a break above, represented by a positive percentage, shows strength.
For hundreds of ETF choices, be sure to reference Thursday’s StatSheet.
For this just closed-out domestic “Buy” cycle, here’s how some of our candidates have fared:
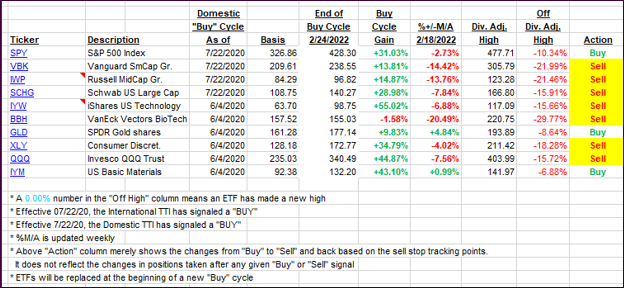
Click image to enlarge.
Again, the %+/-M/A column above shows the position of the various ETFs in relation to their respective long-term trend lines, while the trailing sell stops are being tracked in the “Off High” column. The “Action” column will signal a “Sell” once the -12% point has been taken out in the “Off High” column, which has replaced the prior -8% to -10% limits.
3. Trend Tracking Indexes (TTIs)
After Friday’s rebound, which pushed the Domestic TTI back above its trend line, today, we went the other way and are back in bearish territory. Such aimless meandering, which we have seen for weeks now, are simply signs that the major trend is still uncertain, so we will wait until more clarity appears before a new “Buy” signal will be issued.
This is how we closed 02/28/2022:
Domestic TTI: -0.30% below its M/A (prior close +0.29%)—Sell signal effective 02/24/2022.
International TTI: -0.47% below its M/A (prior close +0.17%)—Buy signal effective 07/22/2020.
Disclosure: I am obliged to inform you that I, as well as my advisory clients, own some of the ETFs listed in the above table. Furthermore, they do not represent a specific investment recommendation for you, they merely show which ETFs from the universe I track are falling within the specified guidelines.
All linked charts above are courtesy of Bloomberg via ZeroHedge.
Contact Ulli