
- Moving the markets
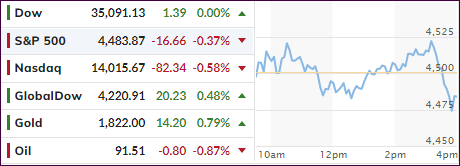
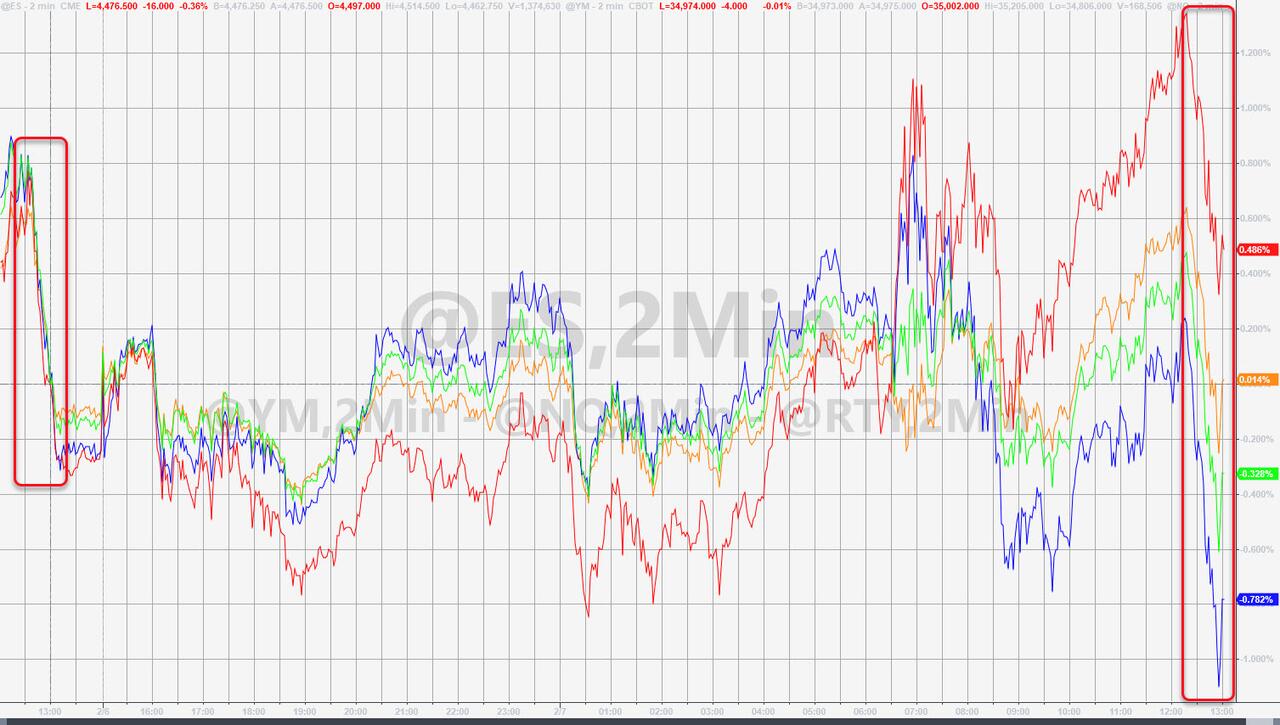
In an almost identical performance to Friday, the major indexes hugged their respective unchanged lines, before a mid-day breakout catapulted all 3 of them out of the red and into green.
Unfortunately, that bullish move did not hold, and we gagged into the close thus giving the bears the upper hand—again. The sell-off was fast and furious with the major indexes closing just about at the lows of the session, with only the Dow recovering to its unchanged line.
The tug-of-war between bulls and bears continued with traders being on edge about the latest earnings reports, as well as crucial US inflation data, with the January CPI due out on Thursday. Anxiety looms as to whether the December print will have worsened. Expectations are for a showing of 7.2% which, if true, would be the fastest gain since February 1982.
This week, we will be watching the latest report cards from about 70 S&P 500 companies. So far, we’ve seen a few earnings beats but also disappointing results from some of the heavyweights like Meta, PayPal and Netflix.
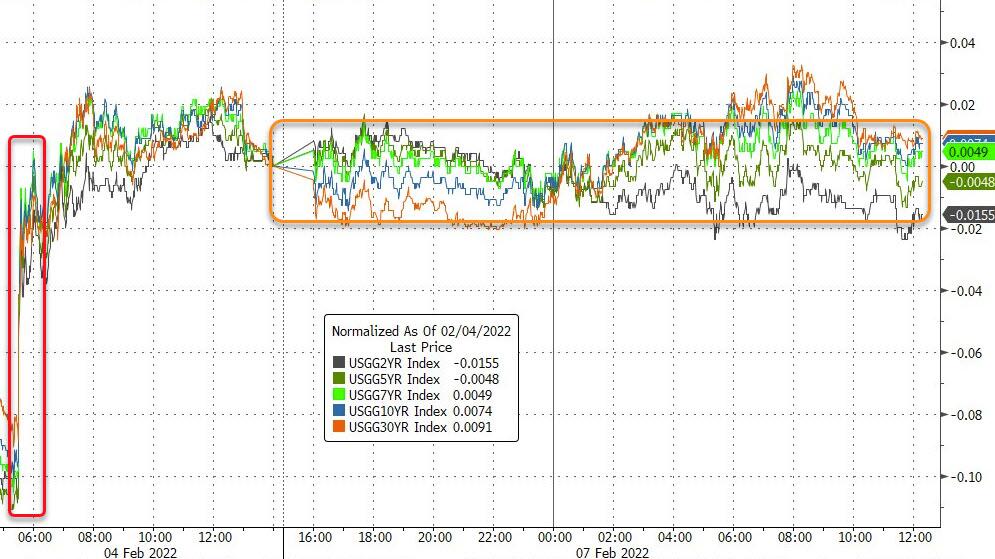
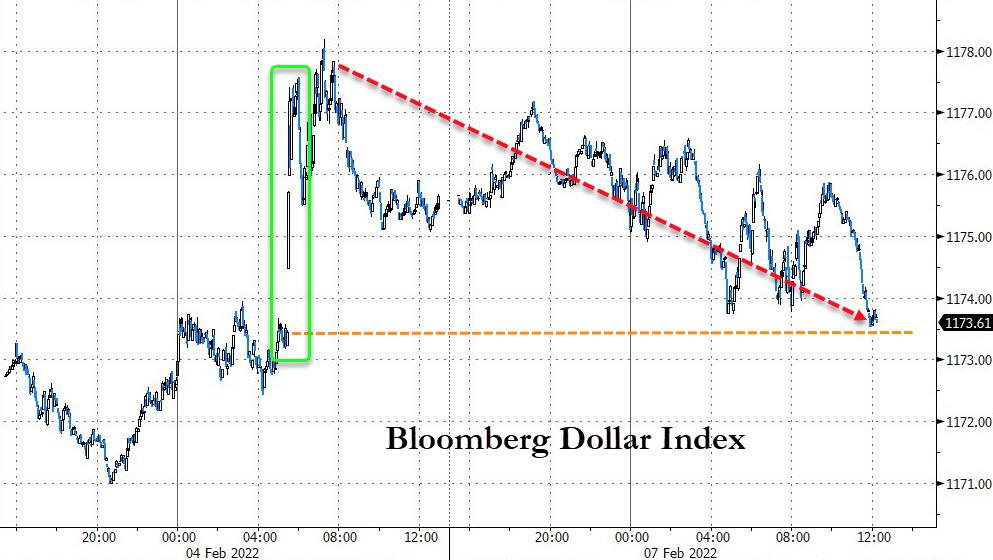
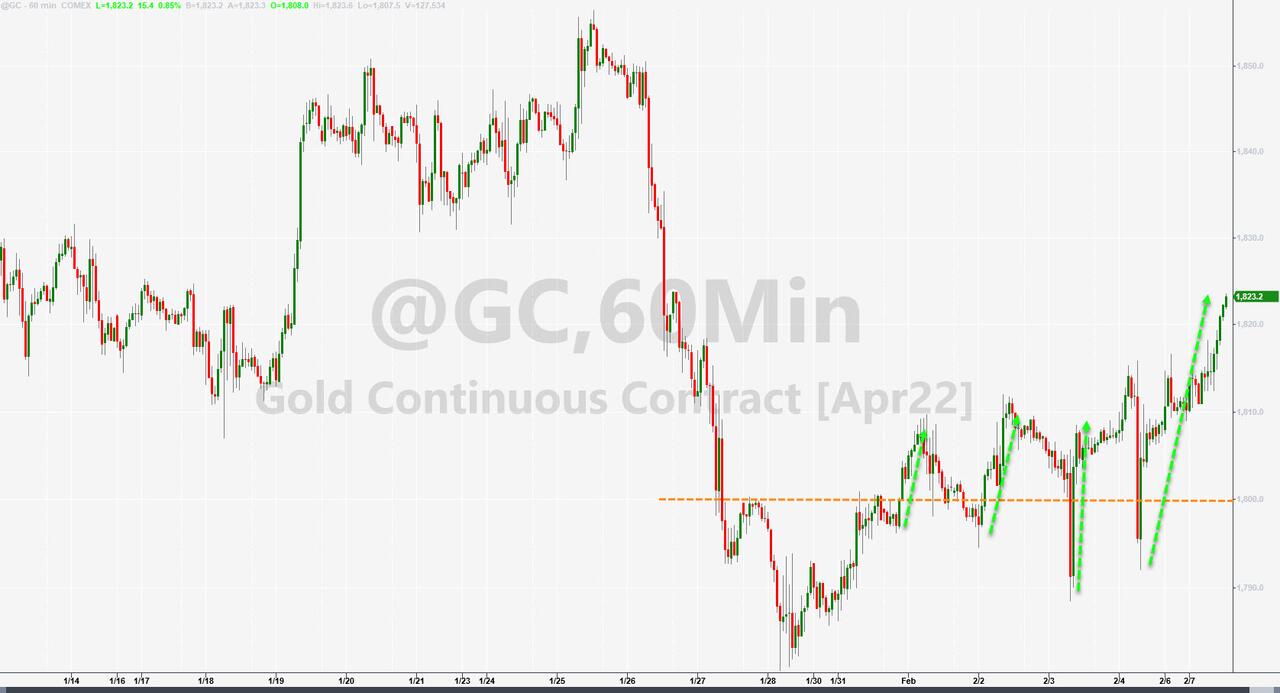
Bond yields went sideways and ended just about unchanged, while the US Dollar broke down and gave back all of Friday’s advance. That helped gold to continue its recent upswing with the precious metal gaining +0.80% for the day.
2. ETFs in the Spotlight
In case you missed the announcement and description of this section, you can read it here again.
It features some of the 10 broadly diversified domestic and sector ETFs from my HighVolume list as posted every Saturday. Furthermore, they are screened for the lowest MaxDD% number meaning they have been showing better resistance to temporary sell offs than all others over the past year.
The below table simply demonstrates the magnitude with which these ETFs are fluctuating above or below their respective individual trend lines (%+/-M/A). A break below, represented by a negative number, shows weakness, while a break above, represented by a positive percentage, shows strength.
For hundreds of ETF choices, be sure to reference Thursday’s StatSheet.
For this current domestic “Buy” cycle, here’s how some of our candidates have fared:
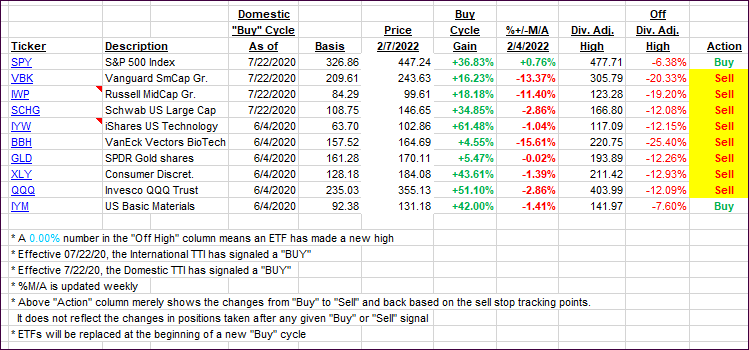
Click image to enlarge.
Again, the %+/-M/A column above shows the position of the various ETFs in relation to their respective long-term trend lines, while the trailing sell stops are being tracked in the “Off High” column. The “Action” column will signal a “Sell” once the -12% point has been taken out in the “Off High” column, which has replaced the prior -8% to -10% limits.
3. Trend Tracking Indexes (TTIs)
Our Domestic TTI gained a fraction, but its international cousin again displayed more strength. However, we are still hovering in neutral territory, from which a breakout in either direction could occur at any time, so caution is warranted.
This is how we closed 02/07/2022:
Domestic TTI: +1.02% above its M/A (prior close +0.95%)—Buy signal effective 07/22/2020.
International TTI: +3.95% above its M/A (prior close +3.48%)—Buy signal effective 07/22/2020.
Disclosure: I am obliged to inform you that I, as well as my advisory clients, own some of the ETFs listed in the above table. Furthermore, they do not represent a specific investment recommendation for you, they merely show which ETFs from the universe I track are falling within the specified guidelines.
All linked charts above are courtesy of Bloomberg via ZeroHedge.
Contact Ulli