
ETF Tracker StatSheet
You can view the latest version here. Please note that due to a database error, I was not able to update this week’s StatSheet. I hope to have that issue resolved by next Thursday.
CHOPPING AND FLOPPING BUT GAINING FOR THE WEEK
- Moving the markets
Another wild week on Wall Street had the major indexes advancing the first 3 trading days before the bears stepped in on Thursday and dampened some of that bullish enthusiasm, but it was not enough to wipe out the early gains. I took advantage of yesterday’s drop to add some new positions.
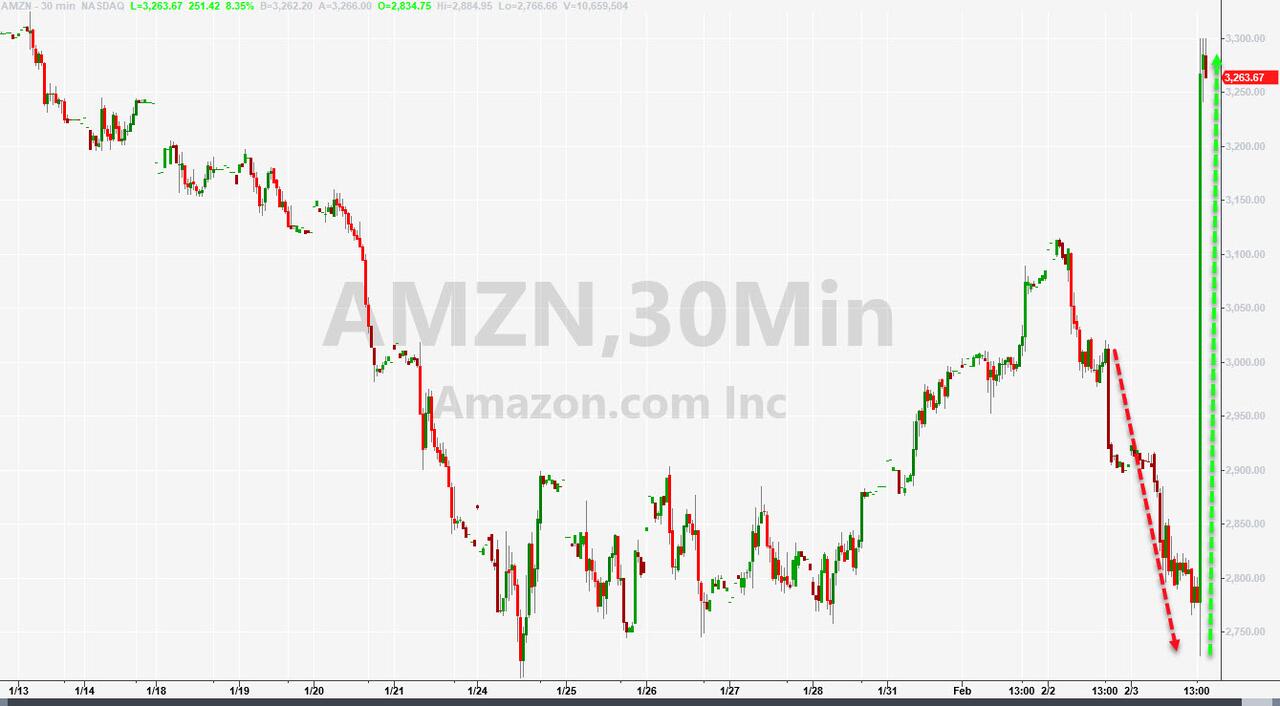
We seem to be at an inflection point with the tug-of-war between bulls and bears getting worse by the day with uncertainty increasing as to who will be the eventual winner. Traders were confused when looking at yesterday’s action, during which Amazon first plunged -7% and later surged nearly 20% due to great earnings and a positive outlook.
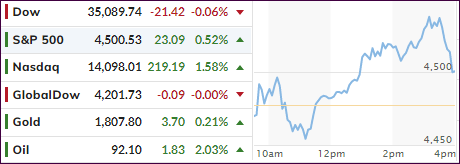
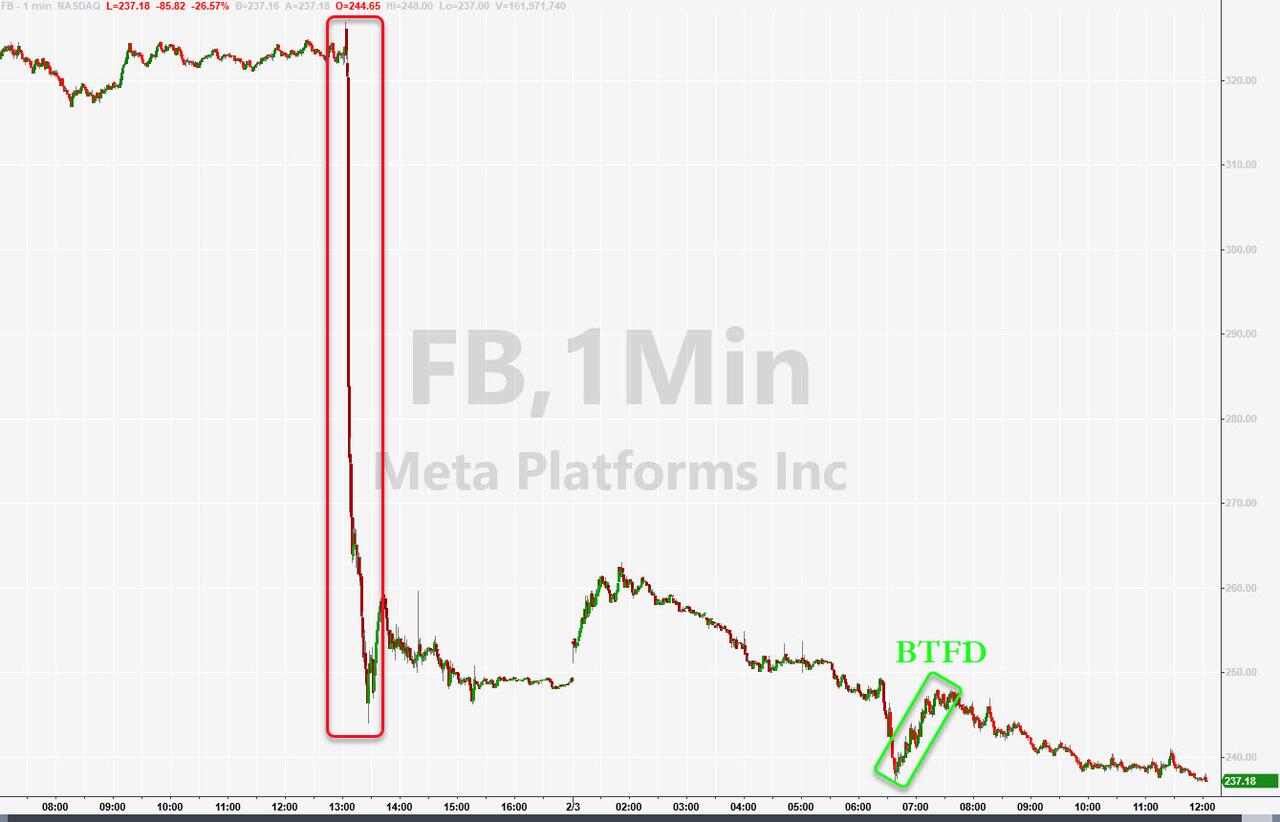
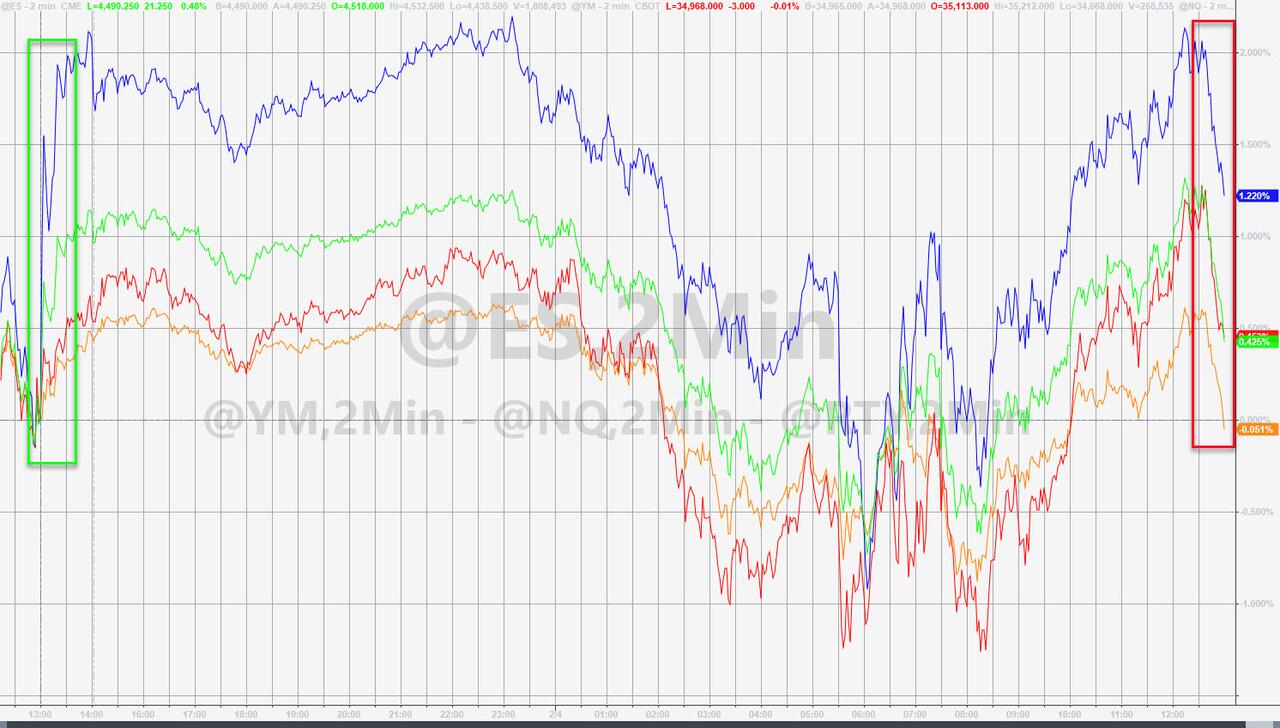
A balanced bond/stock portfolio got hammered with stocks puking and bond yields spiking and experiencing its worst day since February 2021, as ZH pointed out. The hangover from Facebook’s faceplant was still present this morning and pushed the markets down sharply, before bullish momentum resumed until a last minute wave of selling pulled the major indexes off their highs, with the Dow actually ending in the red.
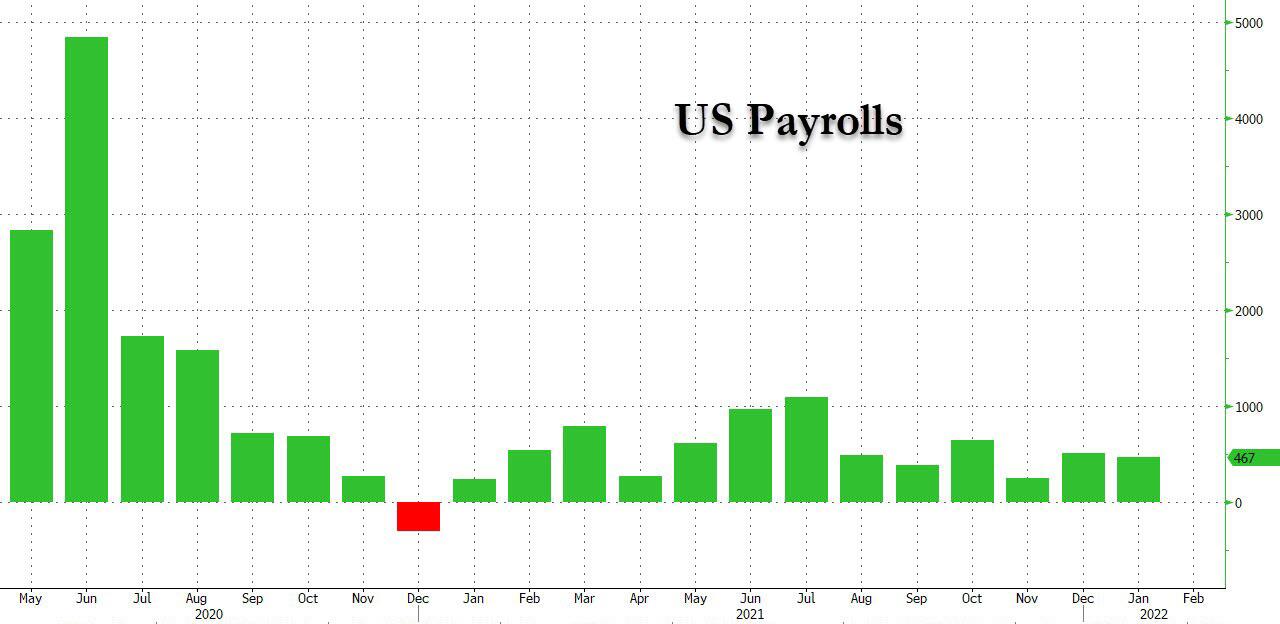
Today’s eagerly anticipated jobs report turned out to be better than expected, and a huge beat, as 467k jobs were added, and the December’s numbers were massively revised higher. The entire report was suspect due to the 709k revisions, which ZH elaborated on:
If we exclude the impact of the annual revision, the January readings would have been -137K for labor force and -272K for household employment.
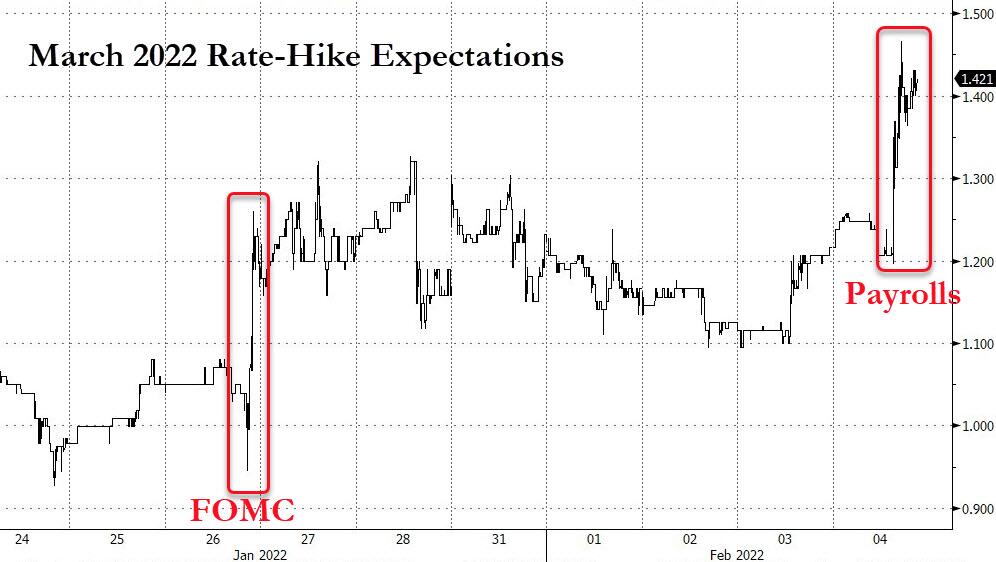
Bond yields continued to surge higher, which gave a boost to the Financials (XLF), which added +1.7% just for the session. March 2022 rate-hike expectations jumped, as the 10-year propelled to almost 1.92%.
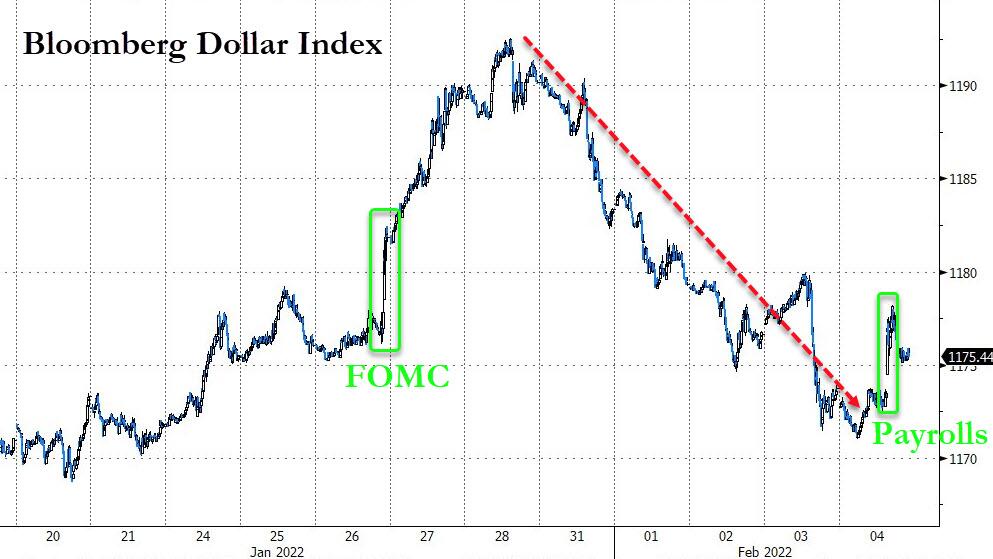
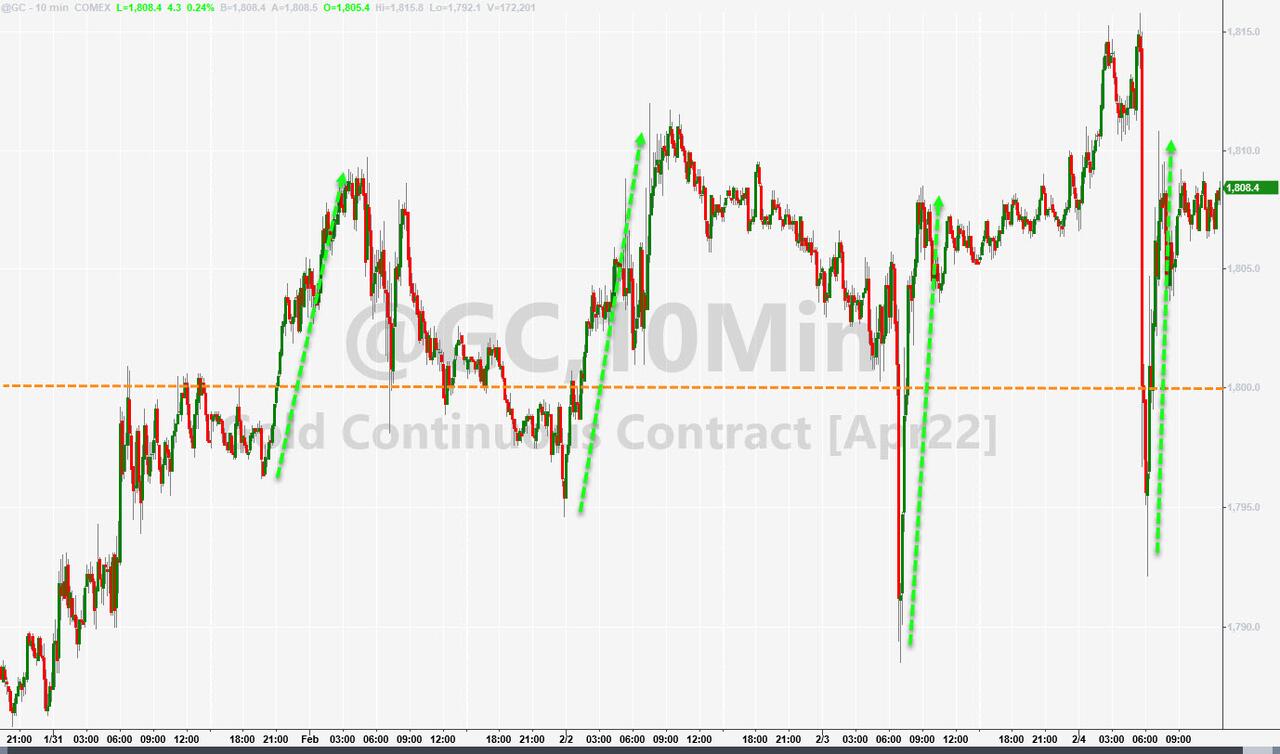
The US Dollar index bounced off its lows, thanks to higher rates, yet gold held steady above its $1,800 level.
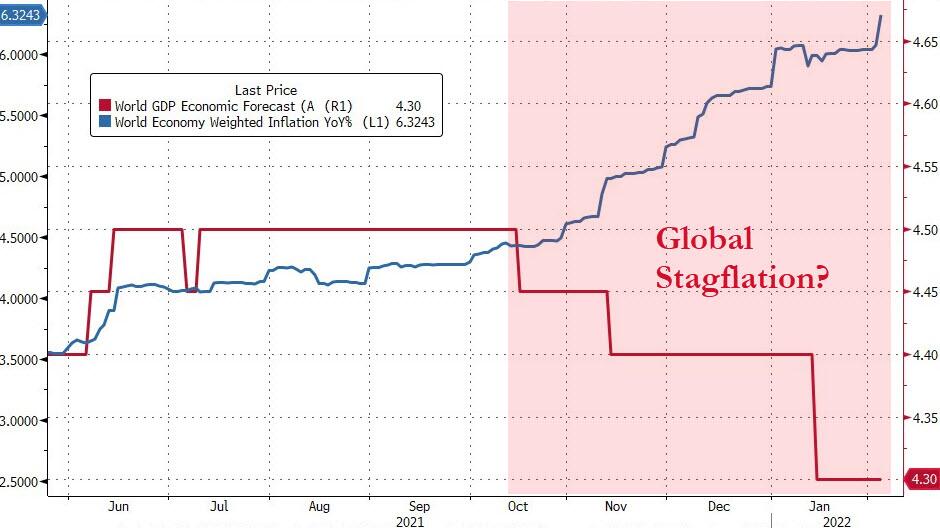
This current environment, be it the economy or the financial markets, is stuck at a fork in the road where anything is possible. Will stagflation be in the cards, as this graph seems to indicate? If so, watch out below.
2. ETFs in the Spotlight
In case you missed the announcement and description of this section, you can read it here again.
It features some of the 10 broadly diversified domestic and sector ETFs from my HighVolume list as posted every Saturday. Furthermore, they are screened for the lowest MaxDD% number meaning they have been showing better resistance to temporary sell offs than all others over the past year.
The below table simply demonstrates the magnitude with which these ETFs are fluctuating above or below their respective individual trend lines (%+/-M/A). A break below, represented by a negative number, shows weakness, while a break above, represented by a positive percentage, shows strength.
For hundreds of ETF choices, be sure to reference Thursday’s StatSheet.
For this current domestic “Buy” cycle, here’s how some of our candidates have fared:

Click image to enlarge.
Again, the %+/-M/A column above shows the position of the various ETFs in relation to their respective long-term trend lines, while the trailing sell stops are being tracked in the “Off High” column. The “Action” column will signal a “Sell” once the -12% point has been taken out in the “Off High” column, which has replaced the prior -8% to -10% limits.
3. Trend Tracking Indexes (TTIs)
Our TTIs dropped a tad despite today’s rebound. This week’s bullish move is still suspect and could turn on a dime bringing the bearish scenario back into play.
This is how we closed 02/04/2022:
Domestic TTI: +0.95% above its M/A (prior close +1.15%)—Buy signal effective 07/22/2020.
International TTI: +3.48% above its M/A (prior close +3.58%)—Buy signal effective 07/22/2020.
Disclosure: I am obliged to inform you that I, as well as my advisory clients, own some of the ETFs listed in the above table. Furthermore, they do not represent a specific investment recommendation for you, they merely show which ETFs from the universe I track are falling within the specified guidelines.
All linked charts above are courtesy of Bloomberg via ZeroHedge.
———————————————————-
WOULD YOU LIKE TO HAVE YOUR INVESTMENTS PROFESSIONALLY MANAGED?
Do you have the time to follow our investment plans yourself? If you are a busy professional who would like to have his portfolio managed using our methodology, please contact me directly or get more details.
Contact Ulli