
- Moving the markets
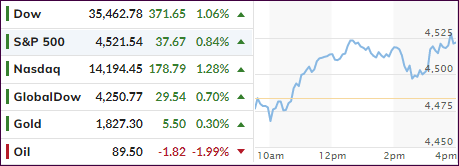
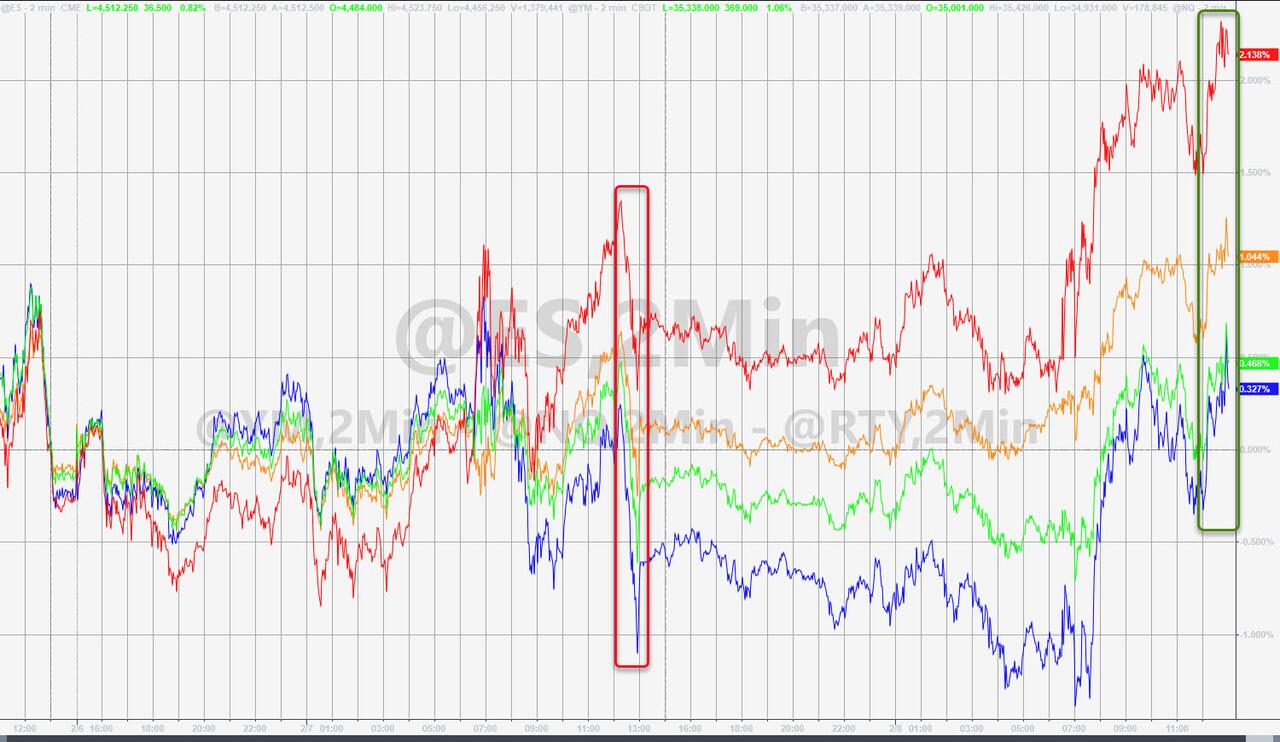
After several breakout attempts over the past two trading sessions, the market finally found some footing that served as a base for today’s last hour lift-a-thon and pushed the major higher without a late-day sell-off ruining another effort.
For a change, the rally was broad and led by the Nasdaq with the Dow in hot pursuit. Today’s driver turned out to be corporate earnings with Harley-Davidson reporting a surprise for the fourth quarter. Traders focused on value in the tech sector and the financials, the latter of which have greatly benefited by a steady rise in bond yields.
Despite today’s advance, equities will likely remain in a holding pattern prior to Thursday’s CPI release. Added MarketWatch:
Wall Street is on edge watching how the Federal Reserve will react to the intensifying price pressures, with many investors eyeing Thursday’s consumer price index data release as a key event for markets this week. The inflation data is expected to show that prices rose 0.4% in January, for a 7.2% gain from one year ago, which would be the highest in almost 40 years.
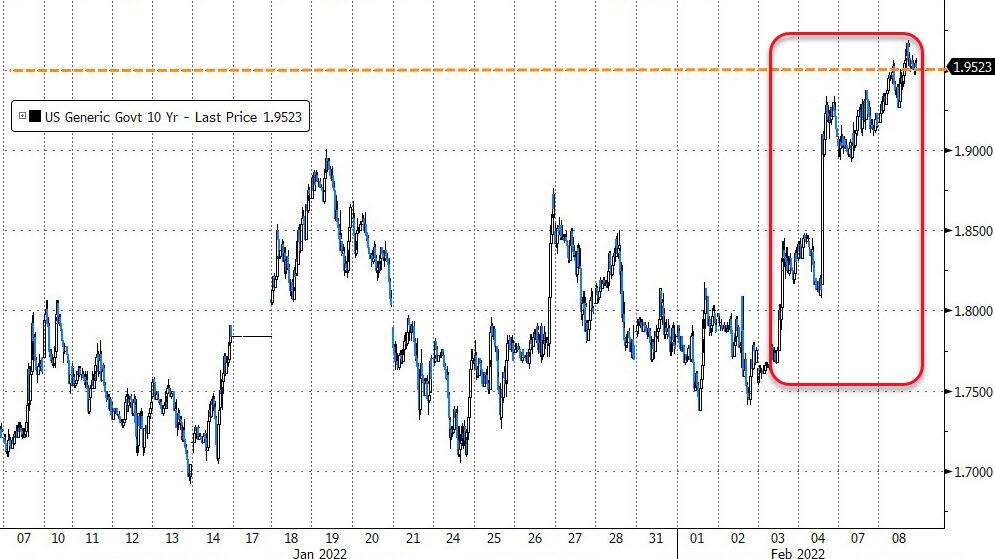
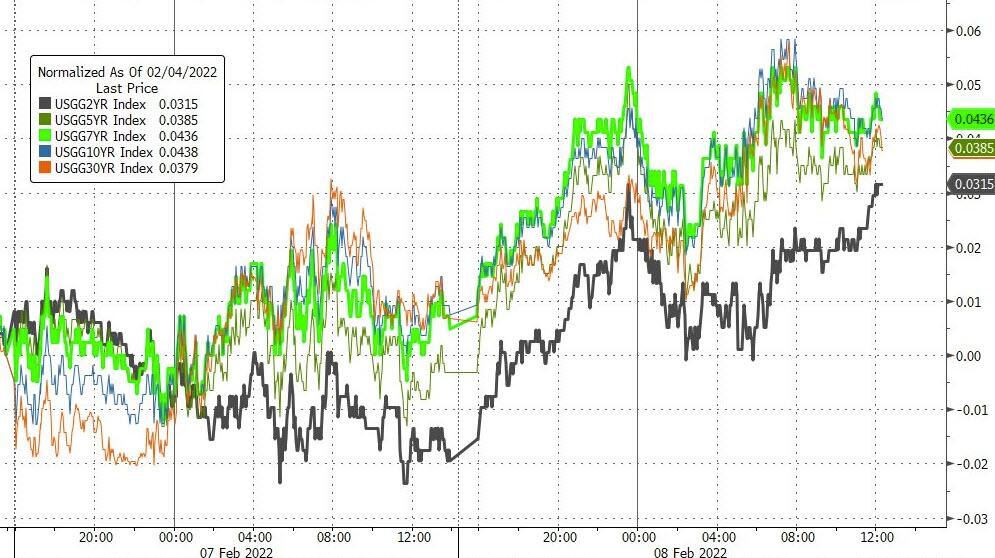
10-year bond yields spiked above the crucial 1.95% level to end then session at 1.96% with the psychologically important 2% level in danger to be broken. All other maturities were higher across the board as well.
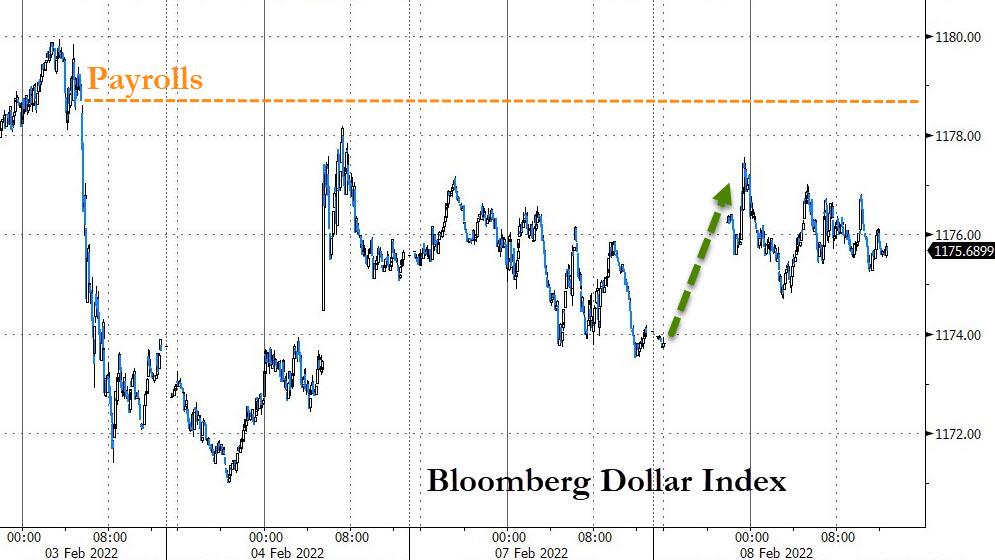
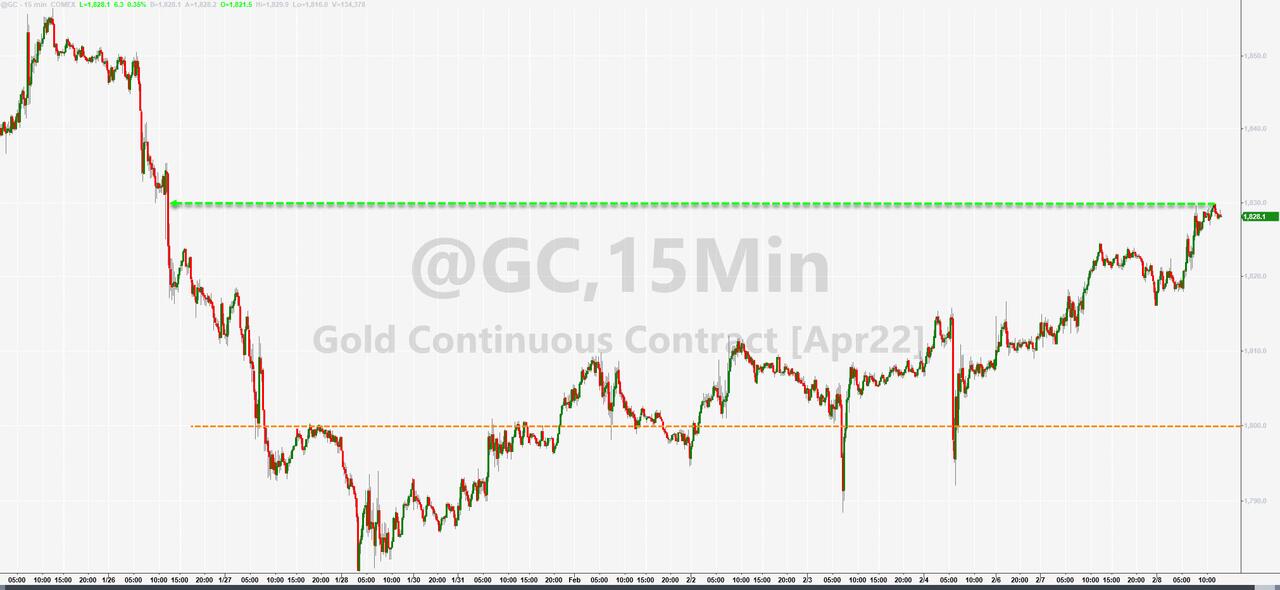
The US Dollar chopped around and closed marginally higher, while gold disregarded bond yields and a rising dollar and added 0.29% to solidify its position above the $1,800 level.
Most of today’s activity will not matter until the CPI is released on Thursday, the outcome of which will likely be determining future market direction. A better-than-expected reading will give the bulls more ammunition to ramp higher due to the then increasing likelihood of the Fed taking a more dovish stance towards future rate hikes. But the opposite will hold true as well.
2. ETFs in the Spotlight
In case you missed the announcement and description of this section, you can read it here again.
It features some of the 10 broadly diversified domestic and sector ETFs from my HighVolume list as posted every Saturday. Furthermore, they are screened for the lowest MaxDD% number meaning they have been showing better resistance to temporary sell offs than all others over the past year.
The below table simply demonstrates the magnitude with which these ETFs are fluctuating above or below their respective individual trend lines (%+/-M/A). A break below, represented by a negative number, shows weakness, while a break above, represented by a positive percentage, shows strength.
For hundreds of ETF choices, be sure to reference Thursday’s StatSheet.
For this current domestic “Buy” cycle, here’s how some of our candidates have fared:
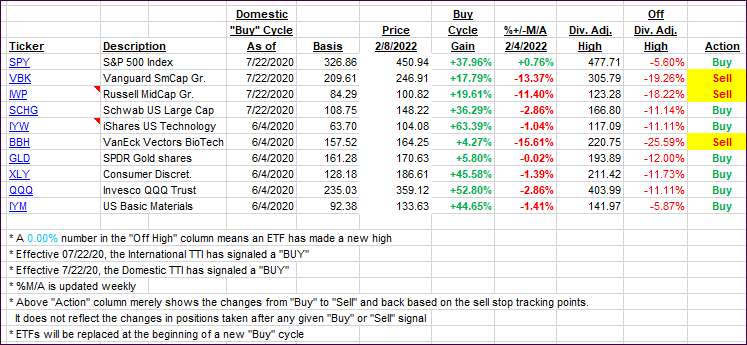
Click image to enlarge.
Again, the %+/-M/A column above shows the position of the various ETFs in relation to their respective long-term trend lines, while the trailing sell stops are being tracked in the “Off High” column. The “Action” column will signal a “Sell” once the -12% point has been taken out in the “Off High” column, which has replaced the prior -8% to -10% limits.
3. Trend Tracking Indexes (TTIs)
Our TTIs gained, as the bulls finally managed to overcome the weakness of the past 2 session.
This is how we closed 02/08/2022:
Domestic TTI: +1.94% above its M/A (prior close +1.02%)—Buy signal effective 07/22/2020.
International TTI: +4.69% above its M/A (prior close +3.95%)—Buy signal effective 07/22/2020.
Disclosure: I am obliged to inform you that I, as well as my advisory clients, own some of the ETFs listed in the above table. Furthermore, they do not represent a specific investment recommendation for you, they merely show which ETFs from the universe I track are falling within the specified guidelines.
All linked charts above are courtesy of Bloomberg via ZeroHedge.
Contact Ulli