
- Moving the markets
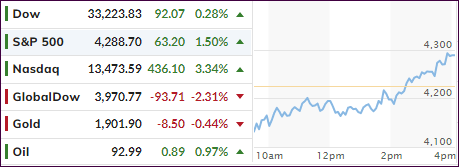
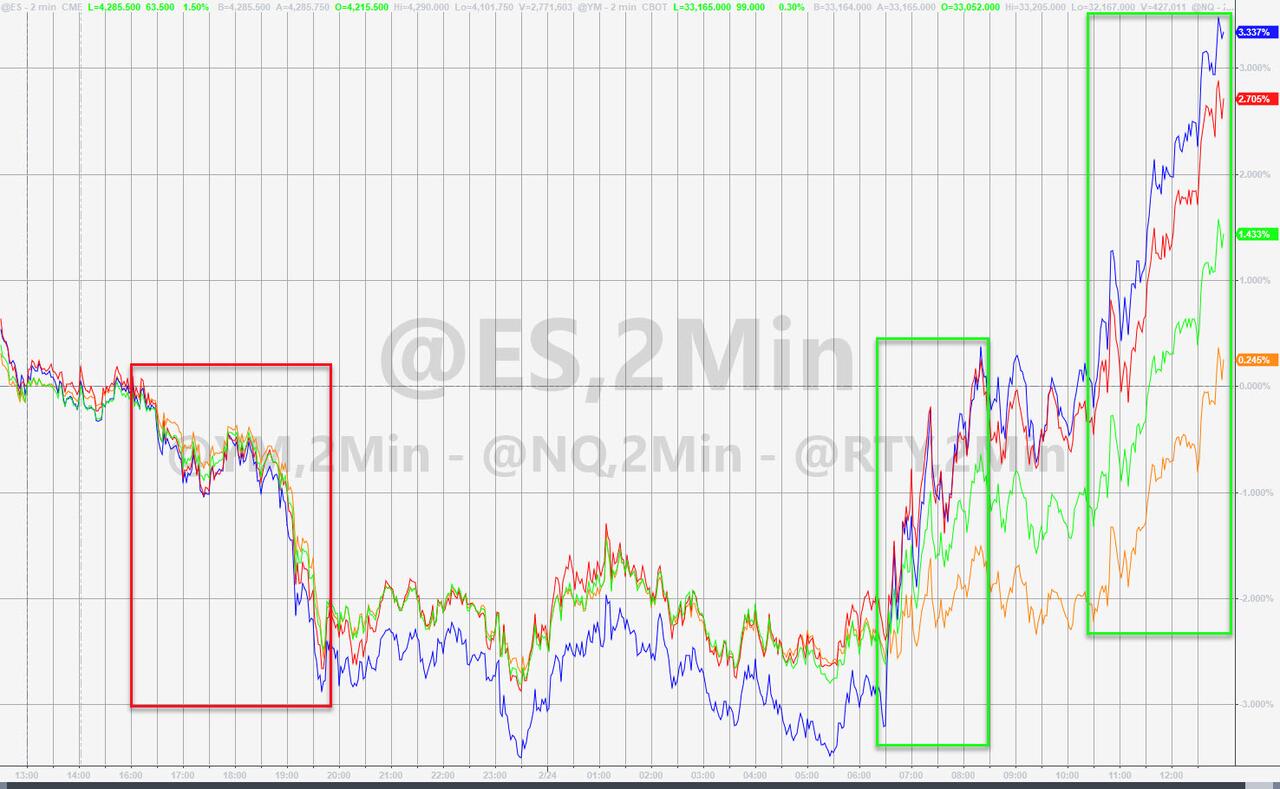
The Russian-Ukraine saber rattling shifted into overdrive and pulled equities down sharply with the Dow down over 850 points at its low of the session.
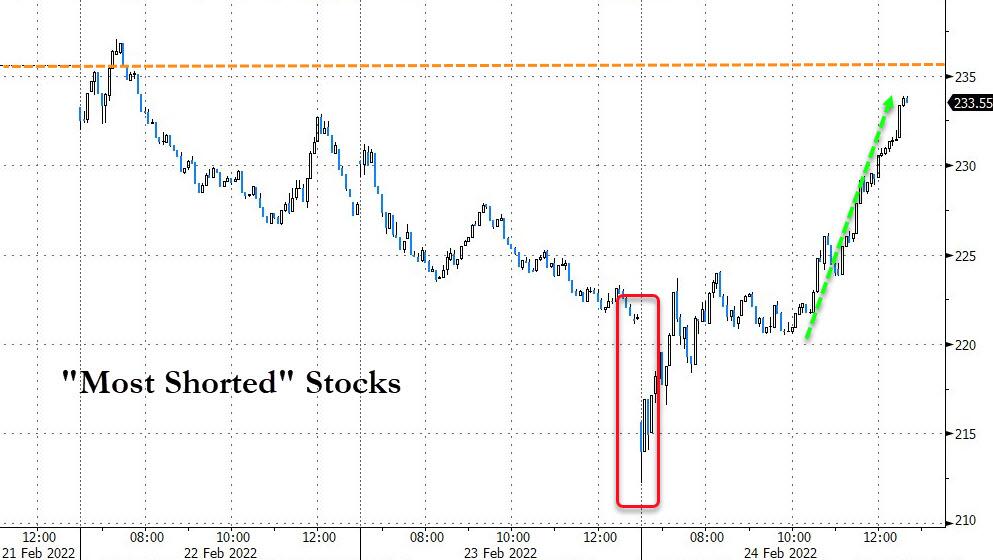
As if by magic, a stunning afternoon comeback managed to wipe out all the morning’s losses with the major indexes ending in the green, as the Nasdaq ruled supreme, and the always present short-squeeze lent its usual assist.
Apparently, traders and algo alike ignored warnings such as the one from Wells Fargo’s analyst “now is not a time to be buying the dip in stocks.” It’s difficult to fathom that the so-called worst invasion since WW 2 is a buying opportunity, as ZH put it.
Nomura’s Charlie McElligott cleared things up by explaining it this way:
If it’s hedge unwinds, not optimism that is driving this, it may leave us open to pullback thereafter unless flows sustain.
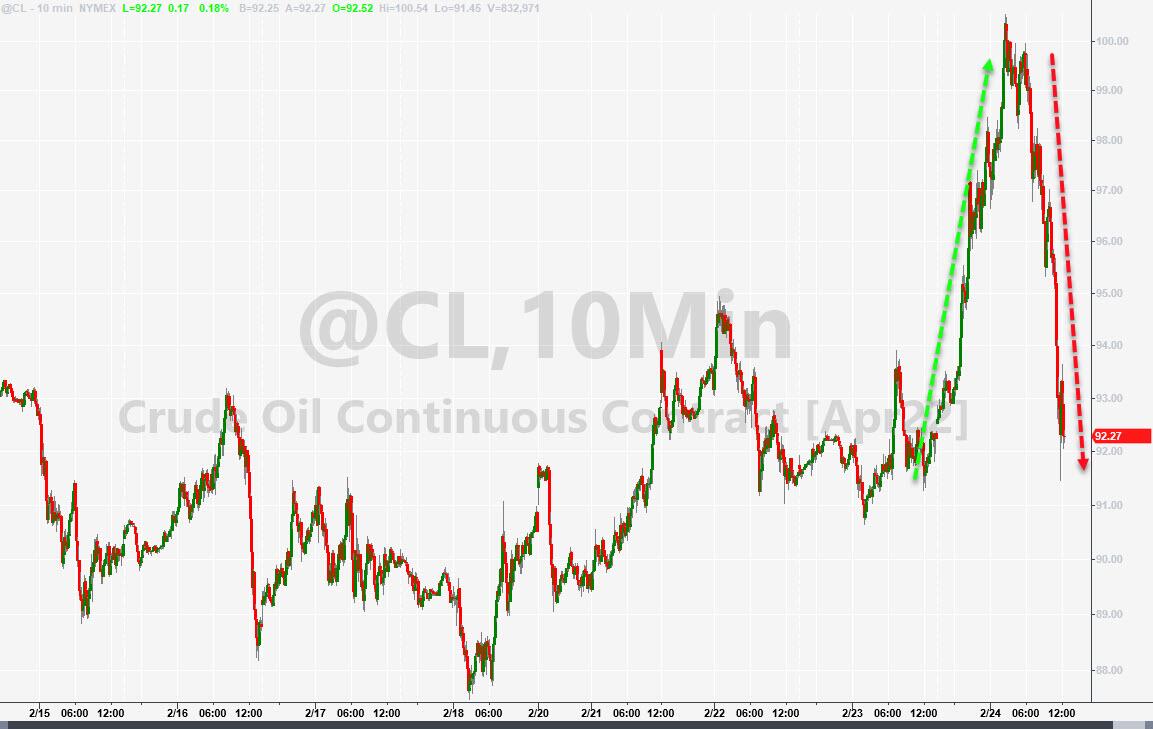
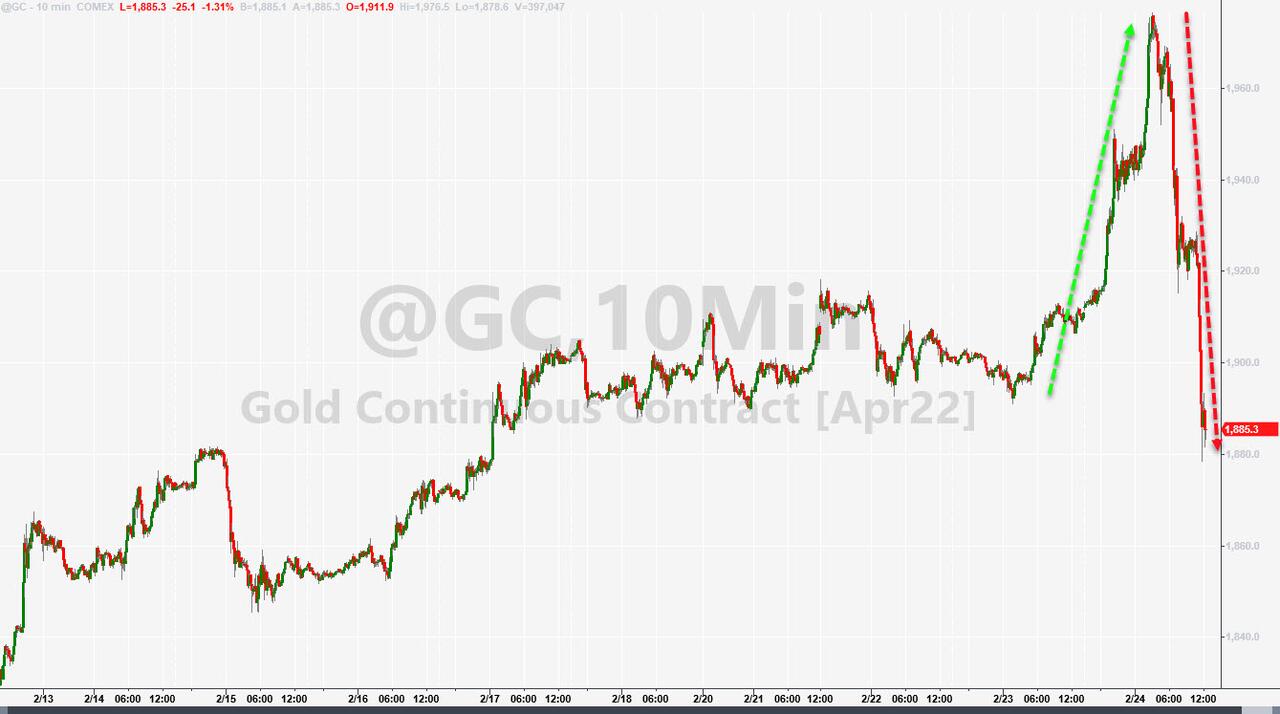
Roundtripping in a wild fashion was Crude Oil, which exploded to over $100 but gave back most of its gains. Gold followed suit and reversed its early advances by losing the $1,900 level.
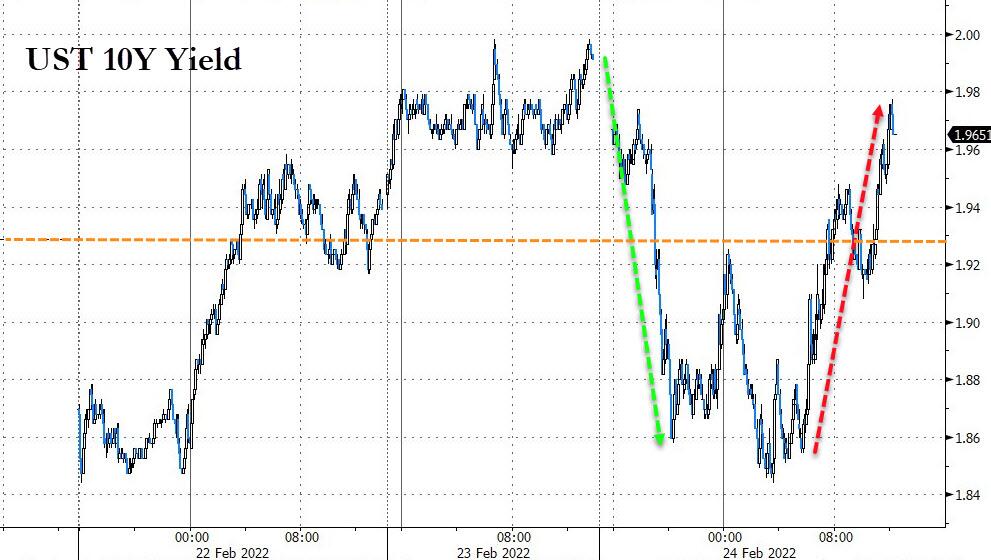
Bond yields enjoyed the rollercoaster ride as well but, while serving as a “safe haven” first (lower yields), then spiking and thereby covering an unusual broad trading range.
Makes you wonder if tomorrow will bring joy or revulsion.
2. ETFs in the Spotlight
In case you missed the announcement and description of this section, you can read it here again.
It features some of the 10 broadly diversified domestic and sector ETFs from my HighVolume list as posted every Saturday. Furthermore, they are screened for the lowest MaxDD% number meaning they have been showing better resistance to temporary sell offs than all others over the past year.
The below table simply demonstrates the magnitude with which these ETFs are fluctuating above or below their respective individual trend lines (%+/-M/A). A break below, represented by a negative number, shows weakness, while a break above, represented by a positive percentage, shows strength.
For hundreds of ETF choices, be sure to reference Thursday’s StatSheet.
For this current domestic “Buy” cycle, here’s how some of our candidates have fared:
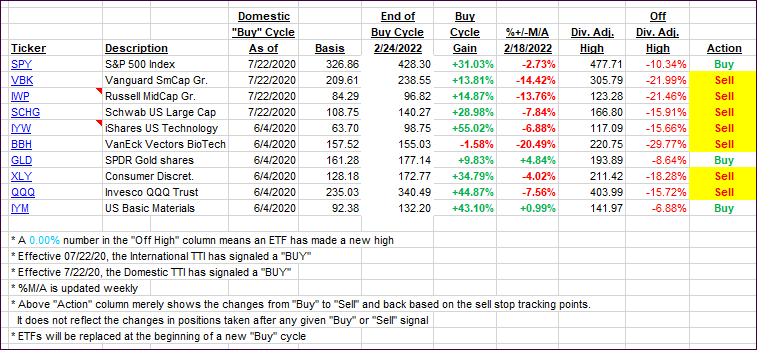
Click image to enlarge.
Again, the %+/-M/A column above shows the position of the various ETFs in relation to their respective long-term trend lines, while the trailing sell stops are being tracked in the “Off High” column. The “Action” column will signal a “Sell” once the -12% point has been taken out in the “Off High” column, which has replaced the prior -8% to -10% limits.
3. Trend Tracking Indexes (TTIs)
Despite the massive afternoon rebound, our Domestic “Sell” signal remained and that cycle, covering “broadly diversified domestic ETFs/mutual funds,” has now ended. We are now focusing on those sector funds that will hold up well in today’s environment.
The International TTI was hit hard today and plunged -2.42% below its trend line. I will it another day or two to be sure this indicator remains in bearish territory before issuing a “Sell” for that arena.
This is how we closed 02/24/2022:
Domestic TTI: -2.24% below its M/A (prior close -3.17%)—Sell signal effective 02/24/2022.
International TTI: -2.42% below its M/A (prior close -0.17%)—Buy signal effective 07/22/2020.
Disclosure: I am obliged to inform you that I, as well as my advisory clients, own some of the ETFs listed in the above table. Furthermore, they do not represent a specific investment recommendation for you, they merely show which ETFs from the universe I track are falling within the specified guidelines.
All linked charts above are courtesy of Bloomberg via ZeroHedge.
Contact Ulli