
- Moving the markets
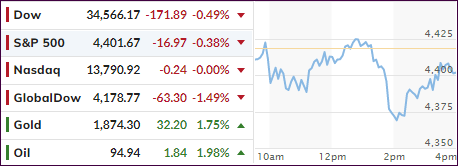
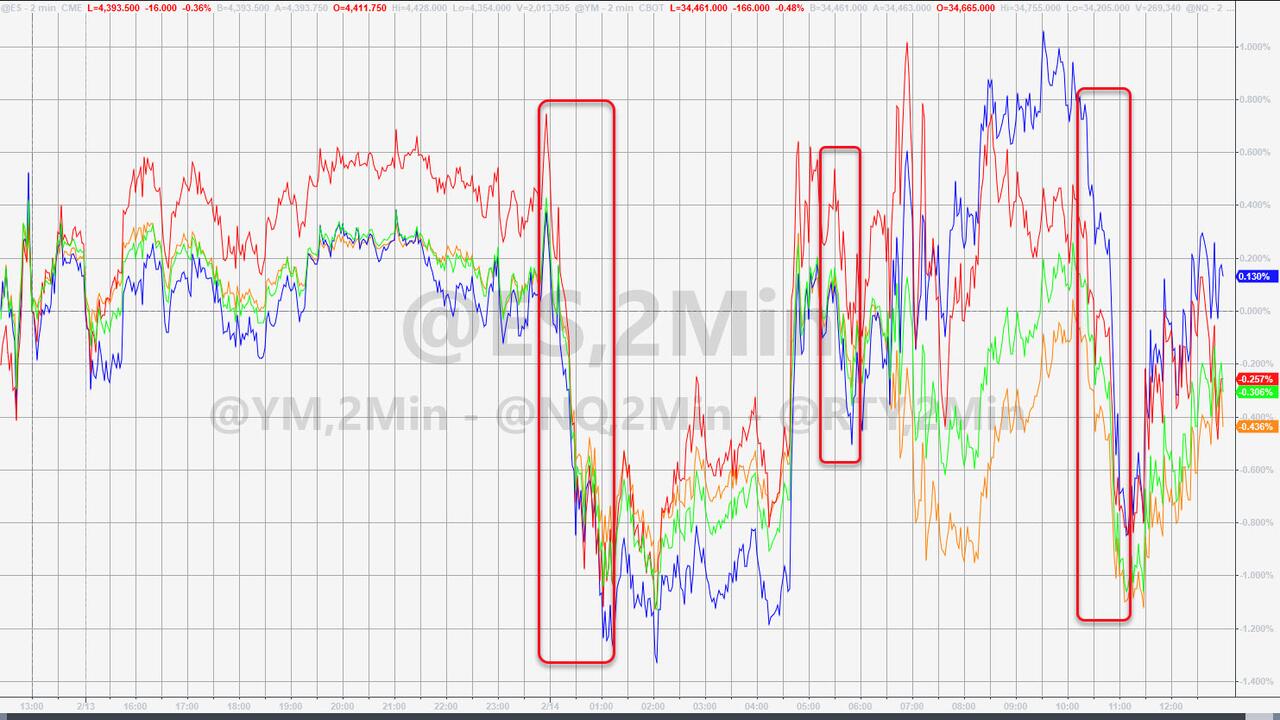
As the chart above shows, Thursday’s and Friday’s dump-a-thon continued into today’s session, with the major indexes plunging in the red, staging a recovery, plunging again, and falling short in their last hour attempt to crawl above their respective unchanged lines.
Relentless headline news fear mongering about increasing tensions between Russia and Ukraine had the markets jumping like a rubber ball in a trampoline factory. Adding to the uncertainty was the Fed’s plan for interest rate hikes.
Fed mouthpiece Bullard suggested that the Central Bank needs to fight inflation more aggressively, which simply confirmed his comments made last week, which wreaked mayhem on the markets:
“I do think we need to front-load more of our planned removal of accommodation than we would have previously. We’ve been surprised to the upside on inflation. This is a lot of inflation.”
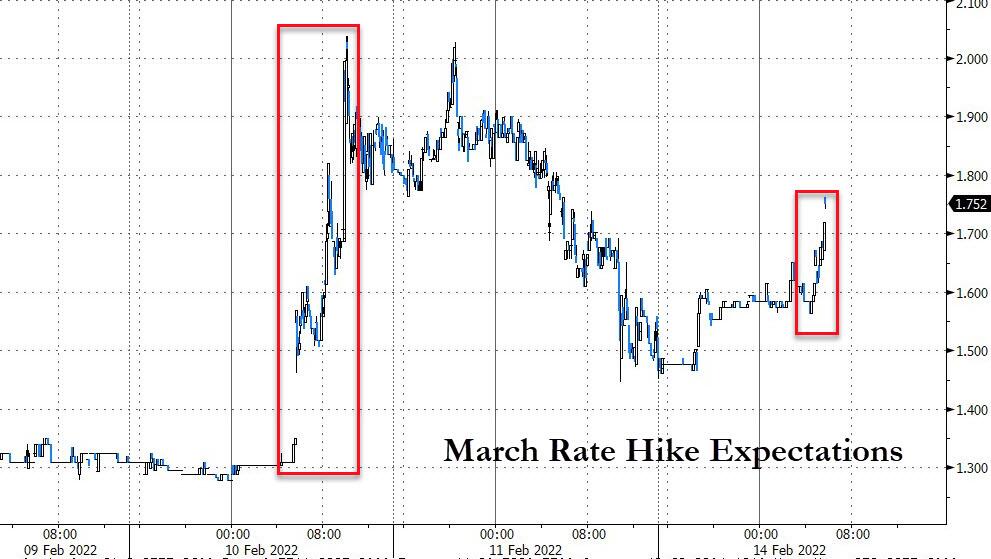
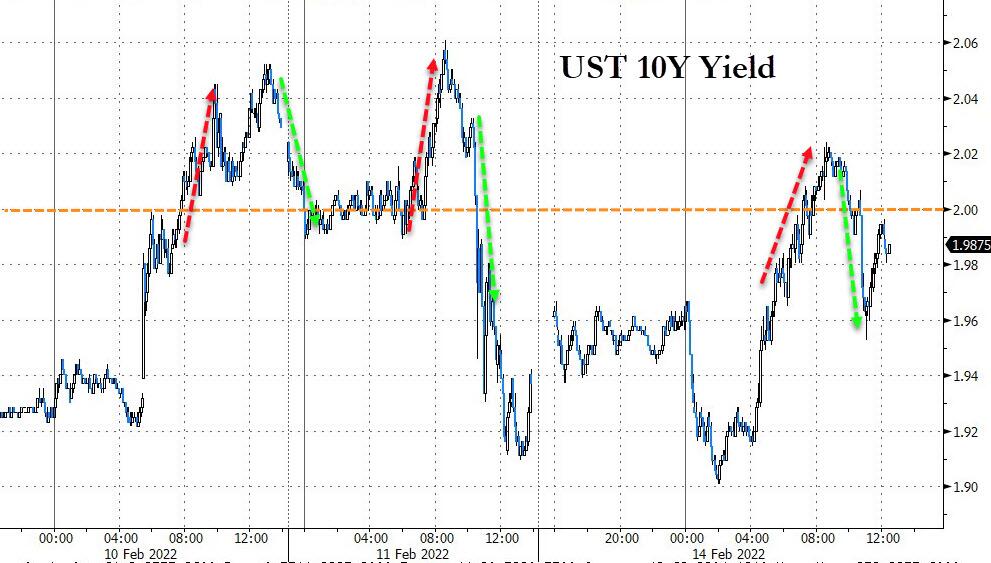
Rate hike expectations moved higher, as the major indexes zig-zagged through the session leaving the question wide open as to how the tug-of-war between bulls and bears might end. Bond yields followed the same pattern with the 10-year pumping and dumping but closing higher.
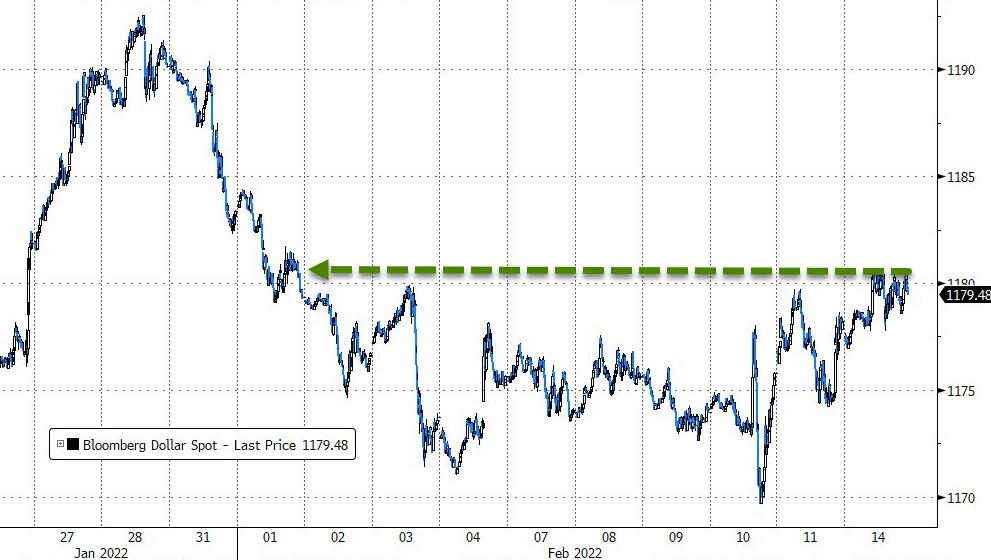
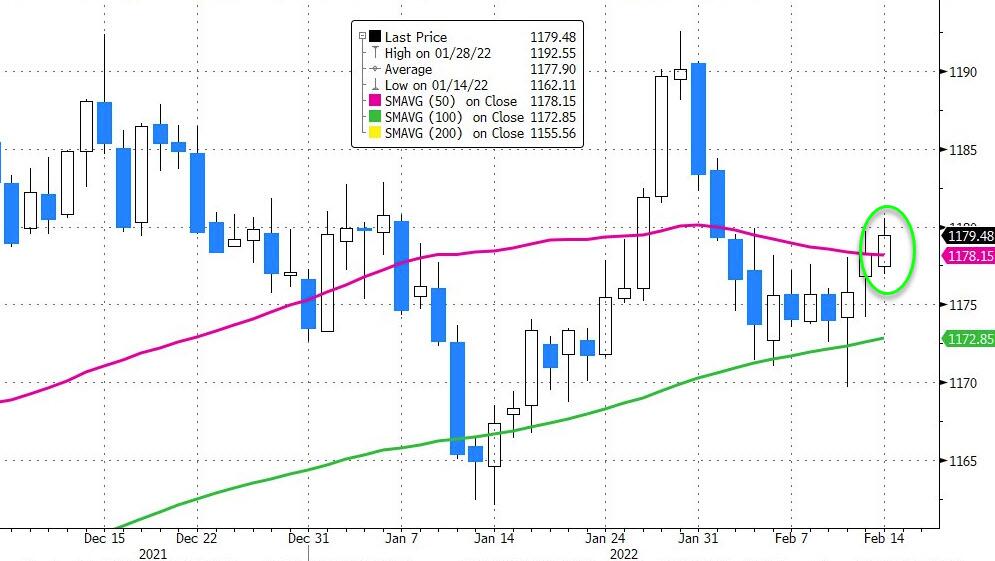
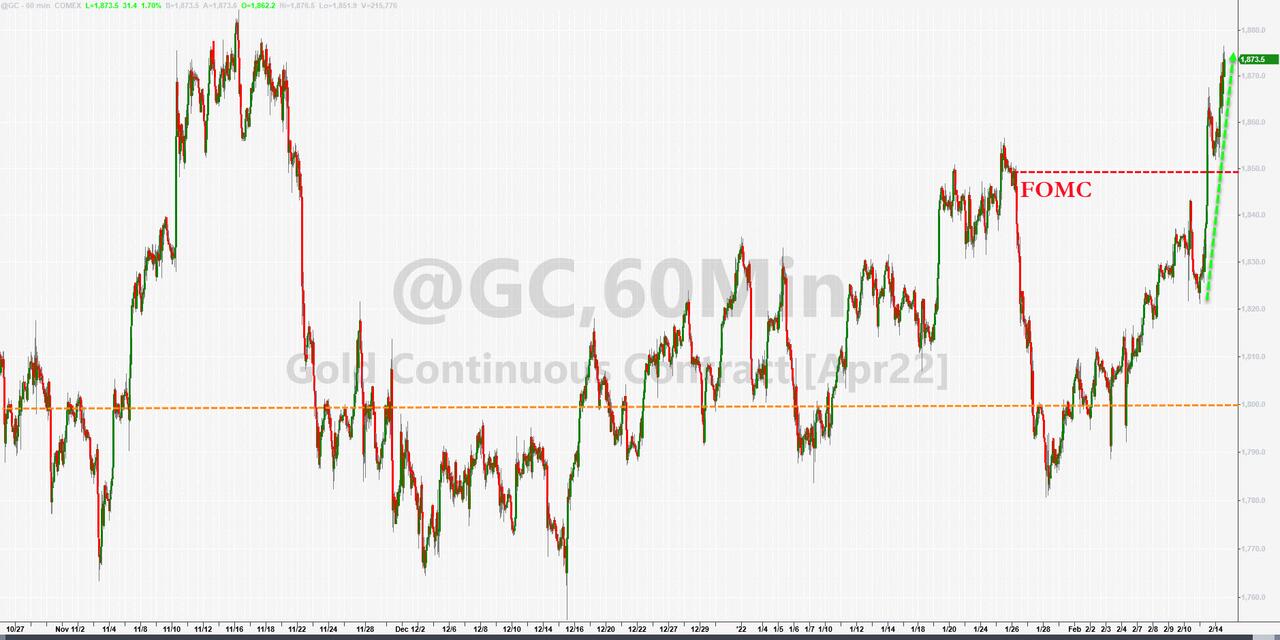
That move caused the US dollar to rally off Friday’s lows and reclaiming its 50-day M/A. The only area of stability was gold, which ripped higher to reach it’s 3 months high, according to ZH.
Leaving this topsy turvy world with a sense of lightheartedness, this tweet made me chuckle:

Continue reading…
2. ETFs in the Spotlight
In case you missed the announcement and description of this section, you can read it here again.
It features some of the 10 broadly diversified domestic and sector ETFs from my HighVolume list as posted every Saturday. Furthermore, they are screened for the lowest MaxDD% number meaning they have been showing better resistance to temporary sell offs than all others over the past year.
The below table simply demonstrates the magnitude with which these ETFs are fluctuating above or below their respective individual trend lines (%+/-M/A). A break below, represented by a negative number, shows weakness, while a break above, represented by a positive percentage, shows strength.
For hundreds of ETF choices, be sure to reference Thursday’s StatSheet.
For this current domestic “Buy” cycle, here’s how some of our candidates have fared:
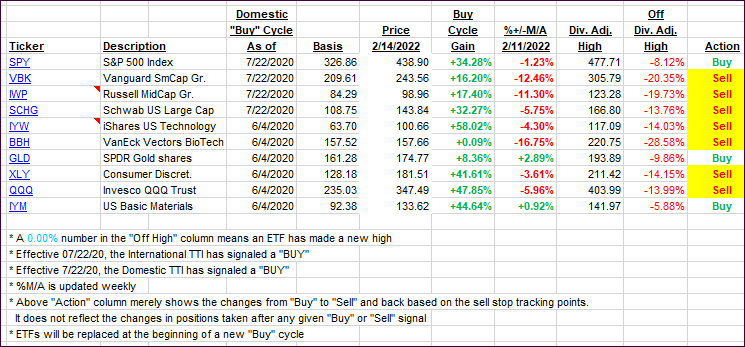
Click image to enlarge.
Again, the %+/-M/A column above shows the position of the various ETFs in relation to their respective long-term trend lines, while the trailing sell stops are being tracked in the “Off High” column. The “Action” column will signal a “Sell” once the -12% point has been taken out in the “Off High” column, which has replaced the prior -8% to -10% limits.
3. Trend Tracking Indexes (TTIs)
Our TTIs continued to slip as market weakness persisted. Please note that the Domestic TTI dropped a tad below its long-term trend line. However, as I keep saying, we need to see more staying power, to avoid a whip-saw signal, before calling this current Buy cycle to be over.
This is how we closed 02/14/2022:
Domestic TTI: -0.23% below its M/A (prior close +0.58%)—Buy signal effective 07/22/2020.
International TTI: +2.78% above its M/A (prior close +4.22%)—Buy signal effective 07/22/2020.
Disclosure: I am obliged to inform you that I, as well as my advisory clients, own some of the ETFs listed in the above table. Furthermore, they do not represent a specific investment recommendation for you, they merely show which ETFs from the universe I track are falling within the specified guidelines.
All linked charts above are courtesy of Bloomberg via ZeroHedge.
Contact Ulli