

- Moving the markets
After three days of pain for the markets, the major indexes finally found some reason to dig themselves out of a deep hole, as the MSM fearmongering about the alleged Russia-Ukraine conflict lost some credibility.
From my viewpoint, this was nothing but a constructed crisis, which ran out of steam today, when the Russian Defense Ministry started returning some troops to their bases after finishing their training exercises.
The ensuing relief rally, with an assist by the usual short squeeze, pushed the major indexes up solidly with the Nasdaq leading the recovery via a 2.53% advance. Even the beaten-down SmallCap sector found some life and rallied 1.9%.
Also helping the bullish mood was news that US Covid cases were down 80% from their January peak, which could be an encouraging signal that the reopening of the economy will pick up speed.
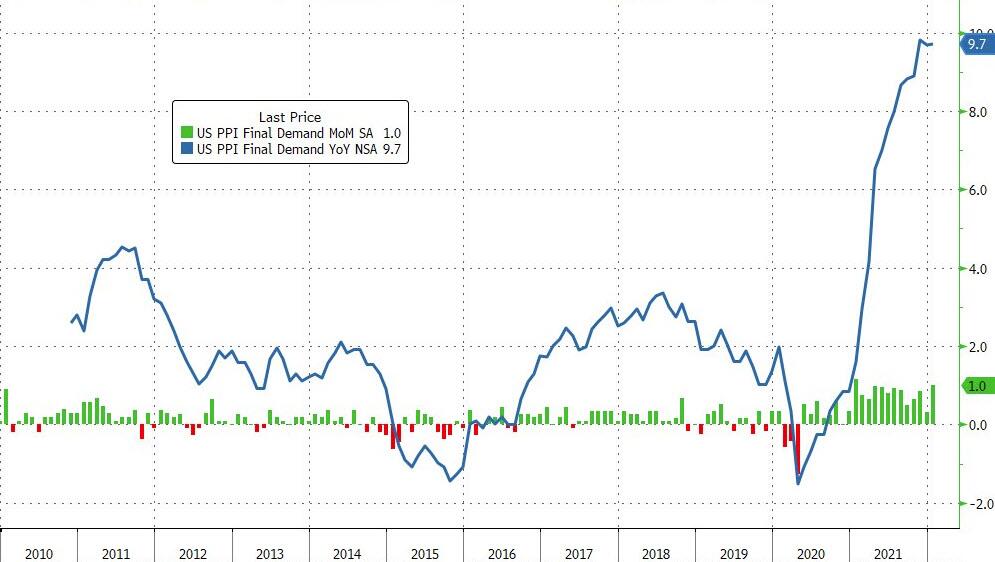
With the focus being on Russia-Ukraine theater, today’s horrific US Producer Price Index (PPI) showed that inflation “unexpectedly remained near record highs in January,” as ZH described it.
The PPI came in twice as bad as expected and printed a 1% MoM gain, which represents its 21st straight month of MoM rises. That translates to a 9.7% YoY figure, more than the expected 9.1% YoY.
While bonds were mixed, it’s noteworthy that that 10-year yield finally exploded above its psychologically important 2% level and settled at 2.055%. However, thanks to the focus on Russia, the markets were not influenced by the spike in yields.
The US Dollar chopped around but dipped into the close losing 0.38%. Gold gave back some of its recent gains as the “invasion premium” became less important, so the precious metal dropped 0.86%.
After our Trend Tracking Index (section 3 below) dropped into bearish territory yesterday, today’s action reversed that process, and we’re back on the bullish side of the trend line—at least for the time being.
2. ETFs in the Spotlight
In case you missed the announcement and description of this section, you can read it here again.
It features some of the 10 broadly diversified domestic and sector ETFs from my HighVolume list as posted every Saturday. Furthermore, they are screened for the lowest MaxDD% number meaning they have been showing better resistance to temporary sell offs than all others over the past year.
The below table simply demonstrates the magnitude with which these ETFs are fluctuating above or below their respective individual trend lines (%+/-M/A). A break below, represented by a negative number, shows weakness, while a break above, represented by a positive percentage, shows strength.
For hundreds of ETF choices, be sure to reference Thursday’s StatSheet.
For this current domestic “Buy” cycle, here’s how some of our candidates have fared:

Click image to enlarge.
Again, the %+/-M/A column above shows the position of the various ETFs in relation to their respective long-term trend lines, while the trailing sell stops are being tracked in the “Off High” column. The “Action” column will signal a “Sell” once the -12% point has been taken out in the “Off High” column, which has replaced the prior -8% to -10% limits.
3. Trend Tracking Indexes (TTIs)
Our TTIs recovered due the markets staging a solid relief rally.
This is how we closed 02/15/2022:
Domestic TTI: +1.30% above its M/A (prior close -0.23%)—Buy signal effective 07/22/2020.
International TTI: +3.75% above its M/A (prior close +2.78%)—Buy signal effective 07/22/2020.
Disclosure: I am obliged to inform you that I, as well as my advisory clients, own some of the ETFs listed in the above table. Furthermore, they do not represent a specific investment recommendation for you, they merely show which ETFs from the universe I track are falling within the specified guidelines.
All linked charts above are courtesy of Bloomberg via ZeroHedge.
Contact Ulli