
- Moving the markets
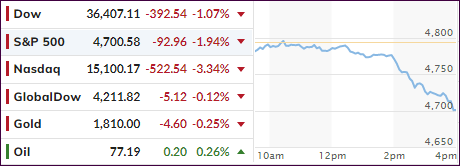
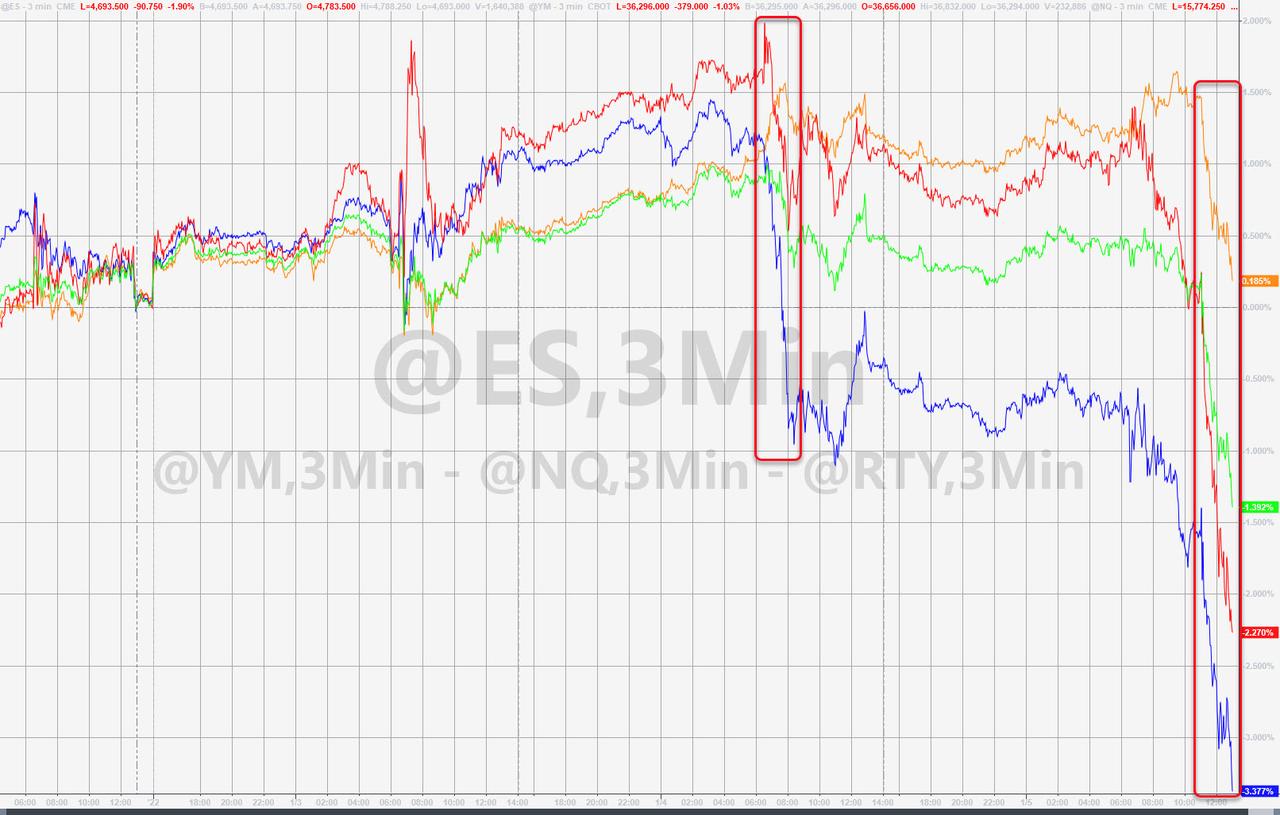
Though the Dow staged a solid rally early in the session, the S&P 500 was barely hanging on to its unchanged line, but the Nasdaq never saw any green numbers. All of this changed mid-day with the major indexes simply losing steam and dumping into the close led by the Nasdaq with a loss of -3.34%.
At the center of this turnaround were the minutes of the Fed’s most recent meeting, which showed members discussing a reduction of their balance sheet right after their intended rate hikes later in 2022.
MarketWatch added some color:
The Fed is tapering its bond purchases now and has already indicated to the market that it will raise rates soon after it finishes that taper in March. But the market is awaiting indications from the Fed on what it will do with its nearly $9 trillion balance sheet once it’s done increasing it. The minutes show officials to be considering shrinking the balance sheet along with raising rates as another way to remove policy accommodation.
Ouch! That was more of a hawkish view than traders had expected and down we went. Remember, the increase of the Fed’s balance sheet is and has been directly correlated with market advances, so a reversal of their policy might have an adverse effect due to a reduction in liquidity.
Adding insult to injury, then this:
“Participants generally noted that, given their individual outlooks for the economy, the labor market, and inflation, it may become warranted to increase the federal funds rate sooner or at a faster pace than participants had earlier anticipated,” the minutes stated.
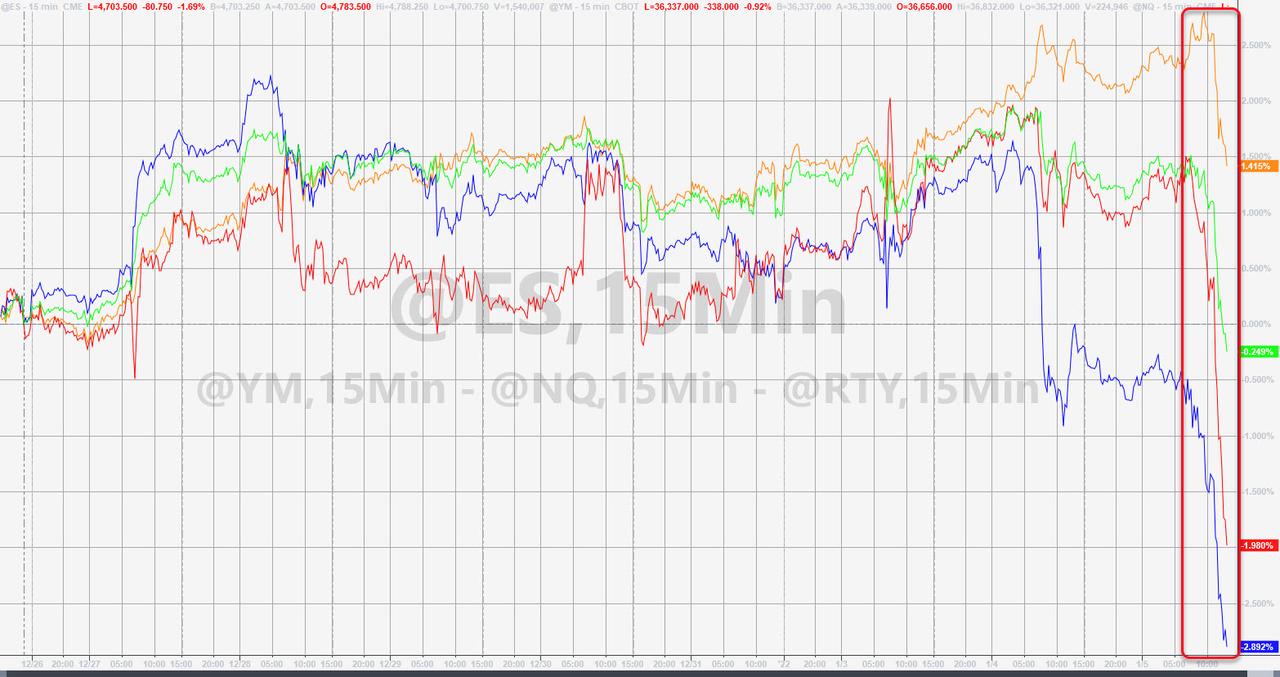
In other words, higher rates and bond yields will be on deck much sooner than expected and may exact their pound of flesh from the markets. As ZeroHedge commented, as of this moment, the entire Santa Claus rally has been erased.
SmallCaps (-4.18%) and Growth (RPG, -3.81%) were hit the hardest, while value (RPV) held up the best by giving back only a modest -0.55%
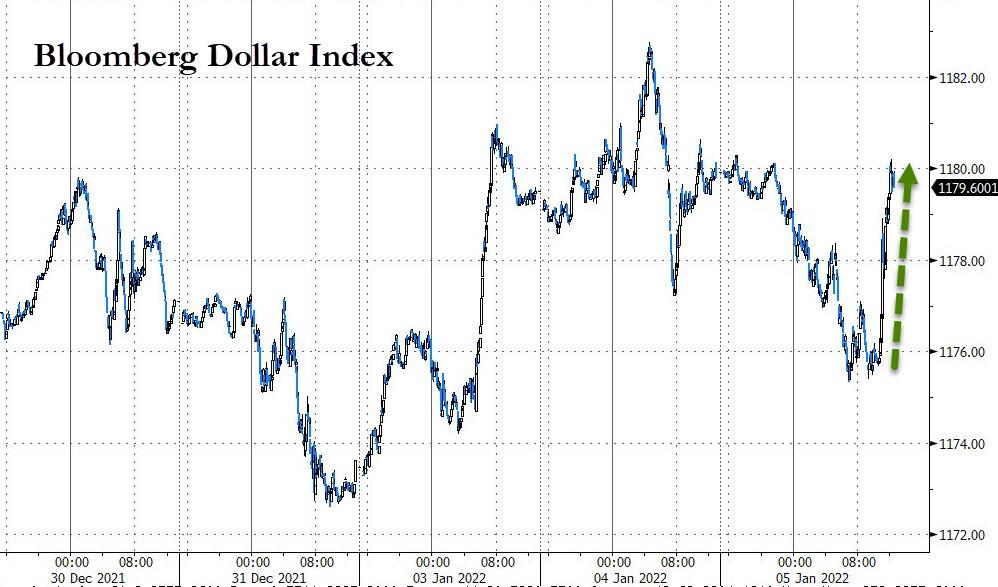
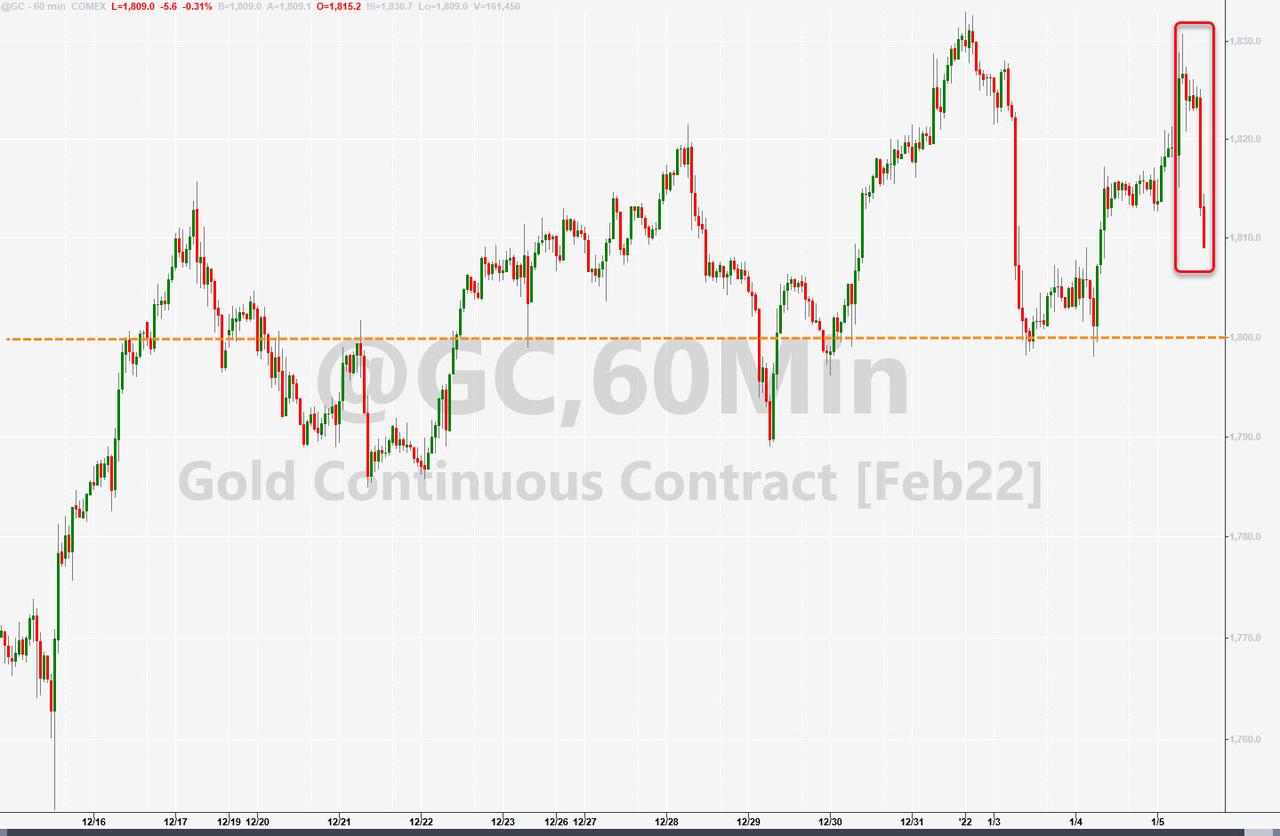
Bond yields rose with the 10-year touching the 1.7% level but closing just a tad below. The US Dollar index rallied and, even though gold held steady above its $1,800 level, it gave back a scant -0.26%.
The question in my mind is this one: How much will the markets have to drop before the Fed reverses policy again and comes to its rescue?
2. ETFs in the Spotlight
In case you missed the announcement and description of this section, you can read it here again.
It features some of the 10 broadly diversified domestic and sector ETFs from my HighVolume list as posted every Saturday. Furthermore, they are screened for the lowest MaxDD% number meaning they have been showing better resistance to temporary sell offs than all others over the past year.
The below table simply demonstrates the magnitude with which these ETFs are fluctuating above or below their respective individual trend lines (%+/-M/A). A break below, represented by a negative number, shows weakness, while a break above, represented by a positive percentage, shows strength.
For hundreds of ETF choices, be sure to reference Thursday’s StatSheet.
For this current domestic “Buy” cycle, here’s how some of our candidates have fared:
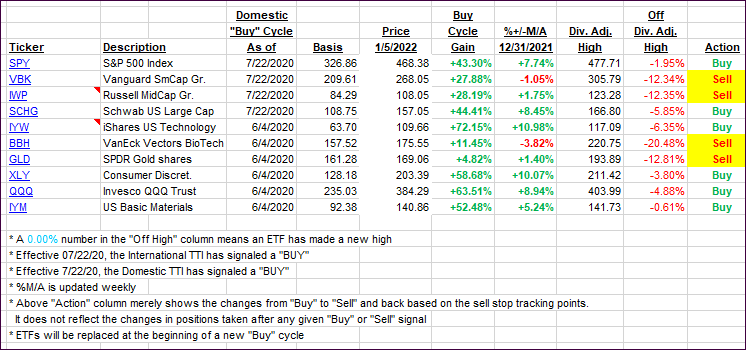
Click image to enlarge.
Again, the %+/-M/A column above shows the position of the various ETFs in relation to their respective long-term trend lines, while the trailing sell stops are being tracked in the “Off High” column. The “Action” column will signal a “Sell” once the -12% point has been taken out in the “Off High” column, which has replaced the prior -8% to -10% limits.
3. Trend Tracking Indexes (TTIs)
Our TTIs pulled back with the Domestic one dumping, along with the major indexes, while the International one barely budged.
This is how we closed 01/05/2022:
Domestic TTI: +5.72% above its M/A (prior close +7.38%)—Buy signal effective 07/22/2020.
International TTI: +4.56% above its M/A (prior close 4.69%)—Buy signal effective 07/22/2020.
Disclosure: I am obliged to inform you that I, as well as my advisory clients, own some of the ETFs listed in the above table. Furthermore, they do not represent a specific investment recommendation for you, they merely show which ETFs from the universe I track are falling within the specified guidelines.
All linked charts above are courtesy of Bloomberg via ZeroHedge.
Contact Ulli