
- Moving the markets
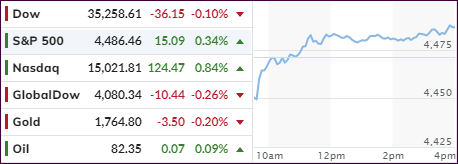
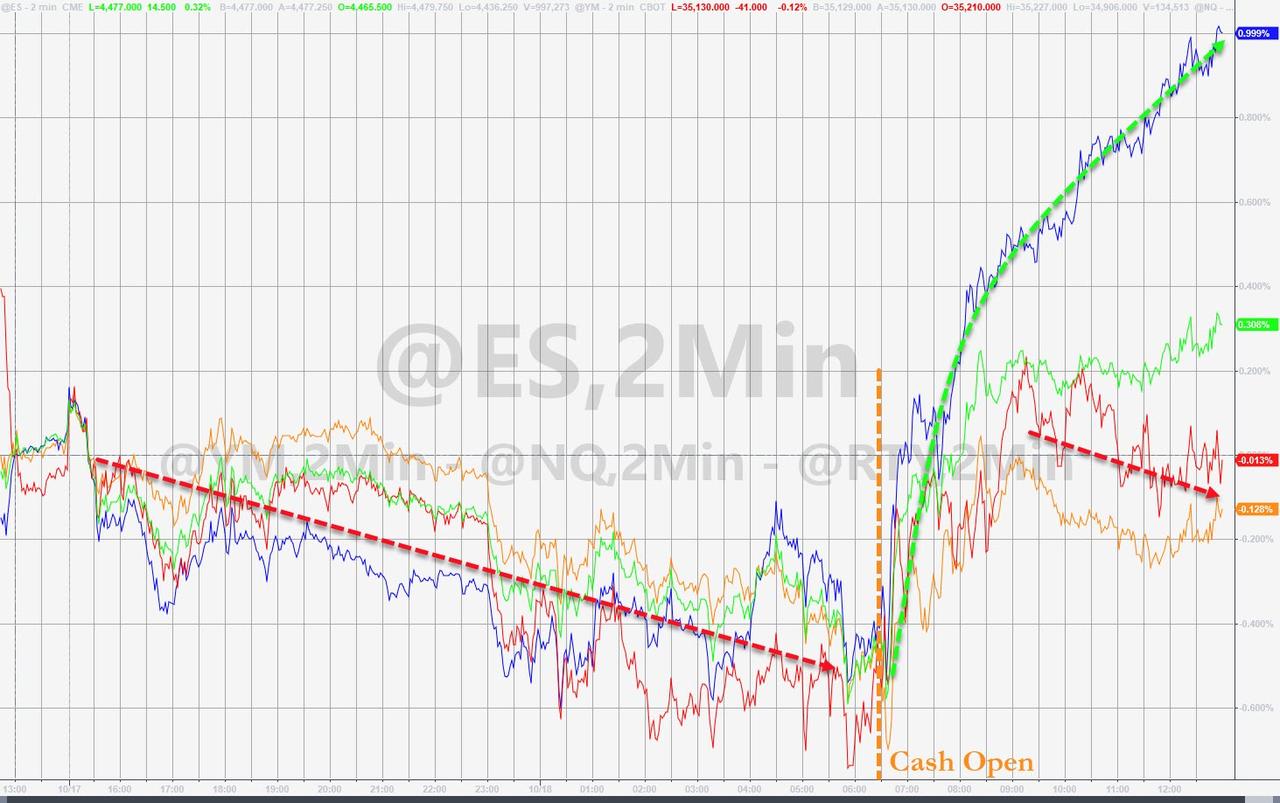
Friday’s ramp-a-thon did not carry through into this morning’s opening, as the major indexes dipped into the red. However, that move was quickly reversed, as equities recovered to close in the green led by the Nasdaq, which registered its fourth consecutive day of gains. The laggard was the Dow, which ended up hugging its unchanged line.
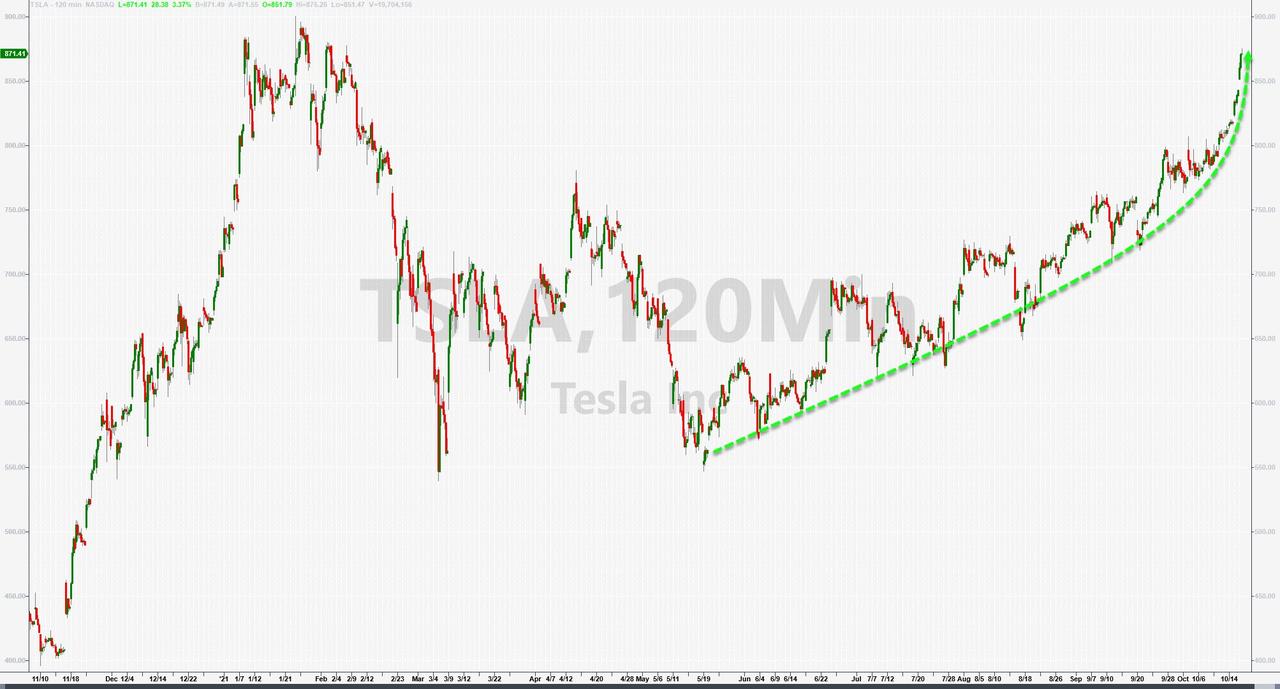
Market support came from optimism of a continuing strong earnings season from major companies such as Netflix, IBM, Verizon, and Tesla. As FactSet reports, 41 of the S&P 500 components have reported Q3 results with 80% of them exceeding EPS expectations.
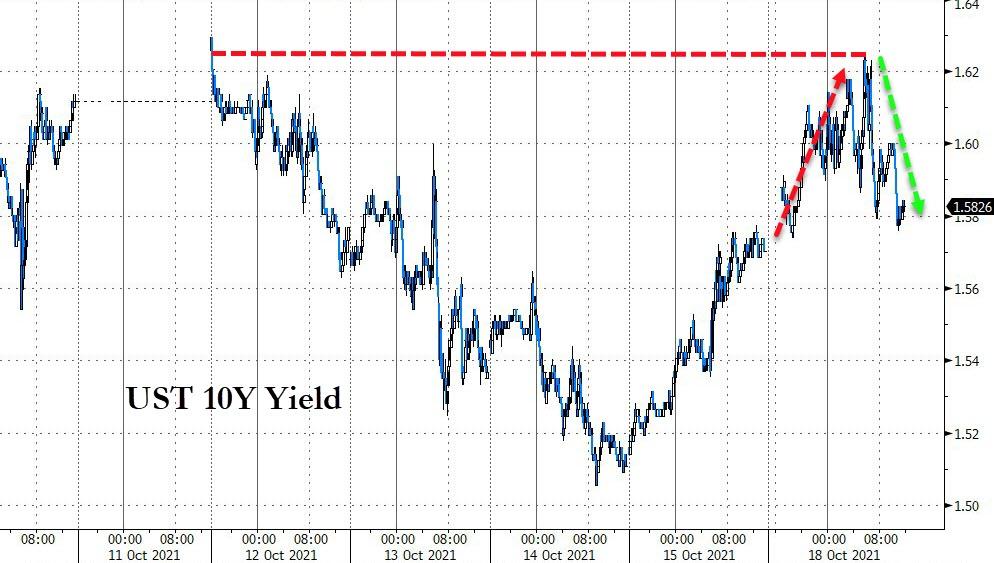
However, not all news was encouraging with China’s meager 4.9% annual GDP growth for Q3 vs. expectations of 5.2% creating disappointment. Then we learned that US Industrial Production declined in September due to supply constraints. Not helping matters either were spiking bond yields with the 10-year at one point reaching the 1.62% level before easing into the close.
None of these events pulled the markets down, and it seemed that the “feel good” sentiment from last week’s lift-a-thon was still firmly engrained in traders’ minds.
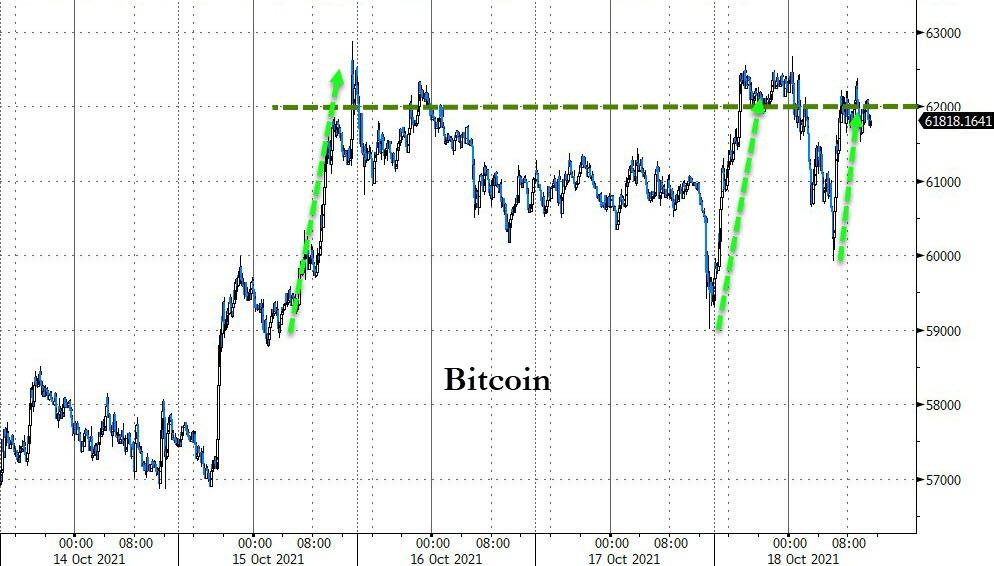
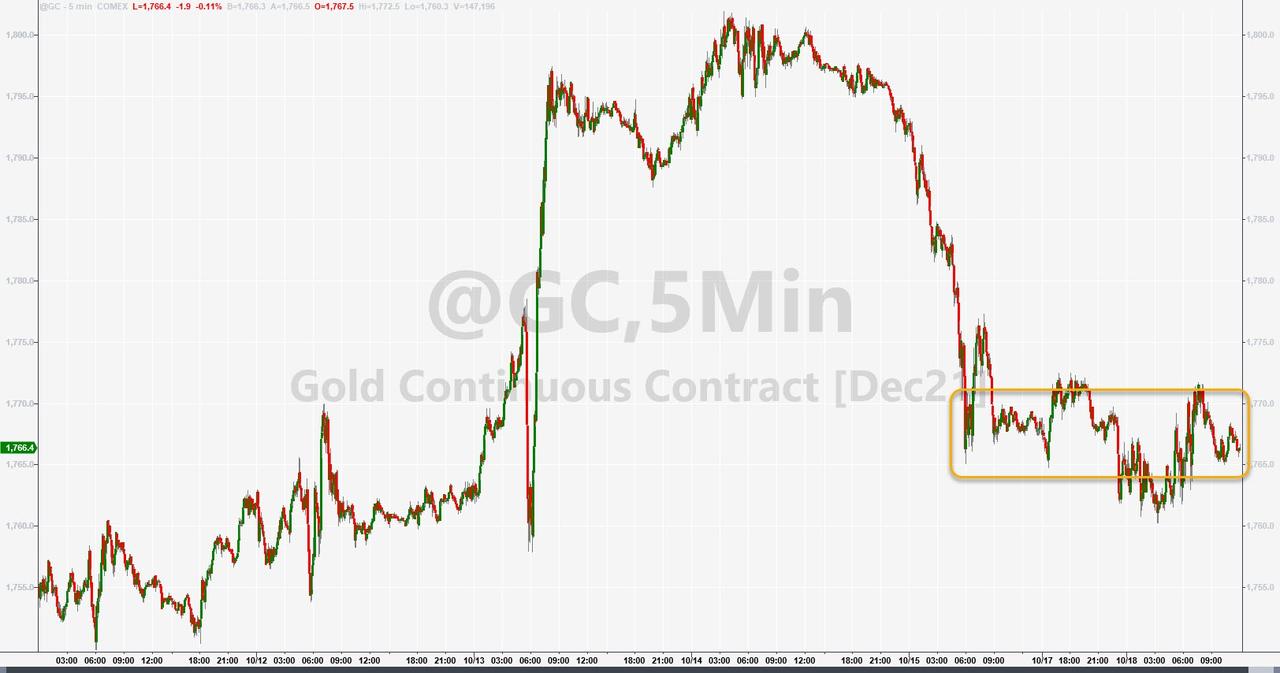
The US Dollar rode the rollercoaster and ended the session about unchanged, while Gold was stuck in a sideways pattern and went nowhere.
Given last week’s strong Friday finish, which easily could have resulted in a Monday sell-off, today’s market action was positive, a condition which may carry on, should the next set of quarterly report cards be in line with recent ones.
2. ETFs in the Spotlight
In case you missed the announcement and description of this section, you can read it here again.
It features some of the 10 broadly diversified domestic and sector ETFs from my HighVolume list as posted every Saturday. Furthermore, they are screened for the lowest MaxDD% number meaning they have been showing better resistance to temporary sell offs than all others over the past year.
The below table simply demonstrates the magnitude with which these ETFs are fluctuating above or below their respective individual trend lines (%+/-M/A). A break below, represented by a negative number, shows weakness, while a break above, represented by a positive percentage, shows strength.
For hundreds of ETF choices, be sure to reference Thursday’s StatSheet.
For this current domestic “Buy” cycle, here’s how some our candidates have fared:
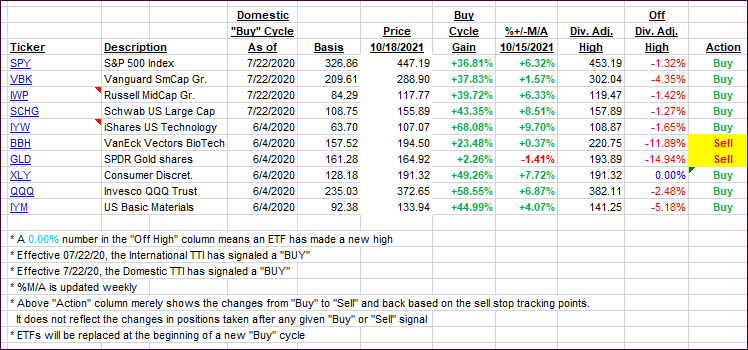
Click image to enlarge.
Again, the %+/-M/A column above shows the position of the various ETFs in relation to their respective long-term trend lines, while the trailing sell stops are being tracked in the “Off High” column. The “Action” column will signal a “Sell” once the -8% point has been taken out in the “Off High” column. For more volatile sector ETFs, the trigger point is -10%.
3. Trend Tracking Indexes (TTIs)
Our TTIs only changed a tad due to today’s market activity not being broad based.
This is how we closed 10/18/2021:
Domestic TTI: +6.28% above its M/A (prior close +6.24%)—Buy signal effective 07/22/2020.
International TTI: +3.90% above its M/A (prior close +4.13%)—Buy signal effective 07/22/2020.
Disclosure: I am obliged to inform you that I, as well as my advisory clients, own some of the ETFs listed in the above table. Furthermore, they do not represent a specific investment recommendation for you, they merely show which ETFs from the universe I track are falling within the specified guidelines.
Contact Ulli