
- Moving the markets
The same old anxieties were moved to the front burner again, namely what the delta variant’s impact might be on the economic reopening. At least that’s the headline news, but looking under the hood for the real reason, it appears to me the fact that 7 million people lost their extra unemployment benefits over the weekend might be closer to the truth.
Not helping the markets, and putting traders in a sour mood, was Goldman Sachs’ (GS) economic outlook downgrade, in which they reduced their annual growth estimate for 2021 to 5.7% from 6.5% and below the consensus of 6.2%. As a side note, GS mentioned that fading fiscal stimulus might be a headwind as well.
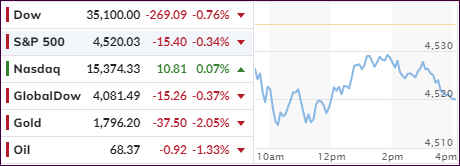
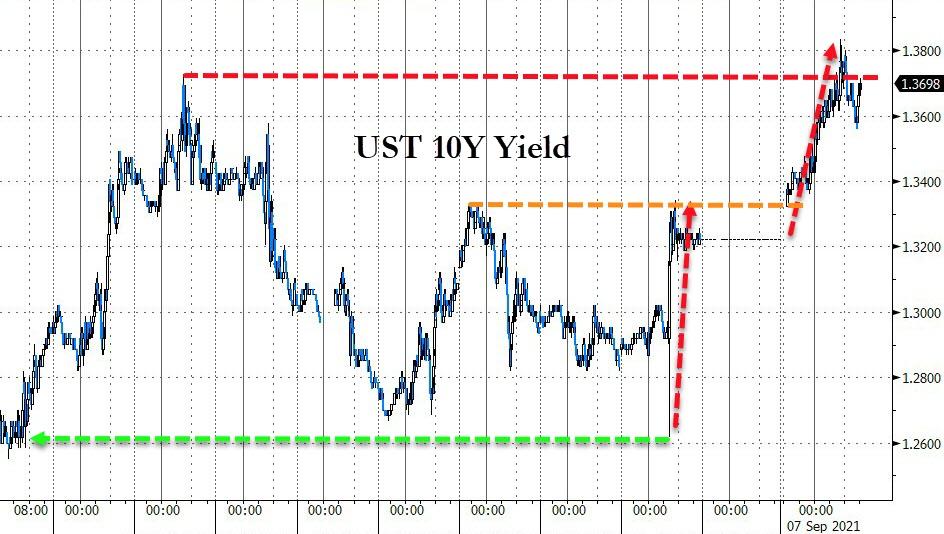
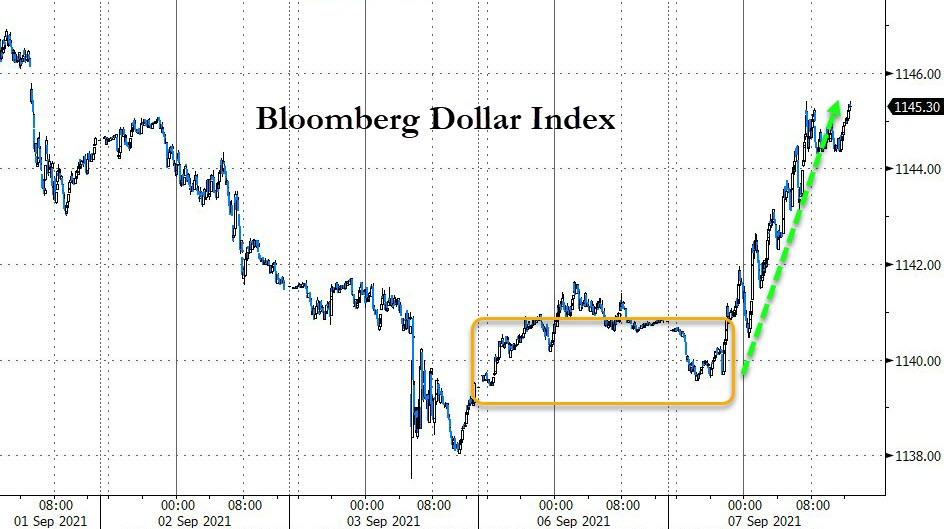
As a result, red numbers prevailed across the board with bonds dropping as yields rose, and the major indexes slumping, except for the Nasdaq, which eked out a small gain. The US Dollar ripped and had its best day in 3 weeks, as the rest of the markets dipped.
The dollars surge proved to be a problem for gold, which got hammered and lost its $1,800 level again.
I agree with ZeroHedge’s comment that “for over a year, US financial conditions have done nothing but get easier and easier and actual US economic data has done nothing but get worse and worse than expectations.”
That’s why I believe that the real economy will now show up and must prove itself, unless “stimmy checks” of gigantic proportions are enacted again.
Just food for thought.
2. ETFs in the Spotlight
In case you missed the announcement and description of this section, you can 8 again.
It features some of the 10 broadly diversified domestic and sector ETFs from my HighVolume list as posted every Saturday. Furthermore, they are screened for the lowest MaxDD% number meaning they have been showing better resistance to temporary sell offs than all others over the past year.
The below table simply demonstrates the magnitude with which these ETFs are fluctuating above or below their respective individual trend lines (%+/-M/A). A break below, represented by a negative number, shows weakness, while a break above, represented by a positive percentage, shows strength.
For hundreds of ETF choices, be sure to reference Thursday’s StatSheet.
For this current domestic “Buy” cycle, here’s how some our candidates have fared:
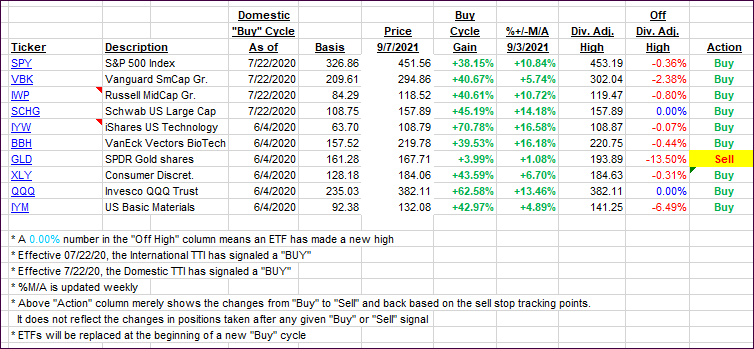
Click image to enlarge.
Again, the %+/-M/A column above shows the position of the various ETFs in relation to their respective long-term trend lines, while the trailing sell stops are being tracked in the “Off High” column. The “Action” column will signal a “Sell” once the -8% point has been taken out in the “Off High” column. For more volatile sector ETFs, the trigger point is -10%.
3. Trend Tracking Indexes (TTIs)
Our TTIs pulled back with the International one being less affected by today’s sell off than the Domestic one.
This is how we closed 09/07/2021:
Domestic TTI: +8.83% above its M/A (prior close +9.74%)—Buy signal effective 07/22/2020.
International TTI: +6.05% above its M/A (prior close +6.09%)—Buy signals effective 07/22/2020.
Disclosure: I am obliged to inform you that I, as well as my advisory clients, own some of the ETFs listed in the above table. Furthermore, they do not represent a specific investment recommendation for you, they merely show which ETFs from the universe I track are falling within the specified guidelines.
All linked charts above are courtesy of Bloomberg via ZeroHedge.
Contact Ulli