
- Moving the markets
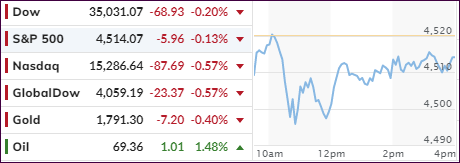
It was a third day in a row of red numbers for the Dow and S&P 500 with the indicators meandering and looking for a base to support the bullish theme. While the three major indexes bounced off the lows for the day, it was not enough to instill confidence in the bears returning the baton back to the bulls.
The economic outlook was foremost on traders’ minds, but since we are in September, known to be one of the most volatile months of the year, more bumpiness may be in the cards. Questionable growth prospects combined with Fed policy, as well as the legislative agendas (cough debt ceiling, cough), may keep buyers in check.
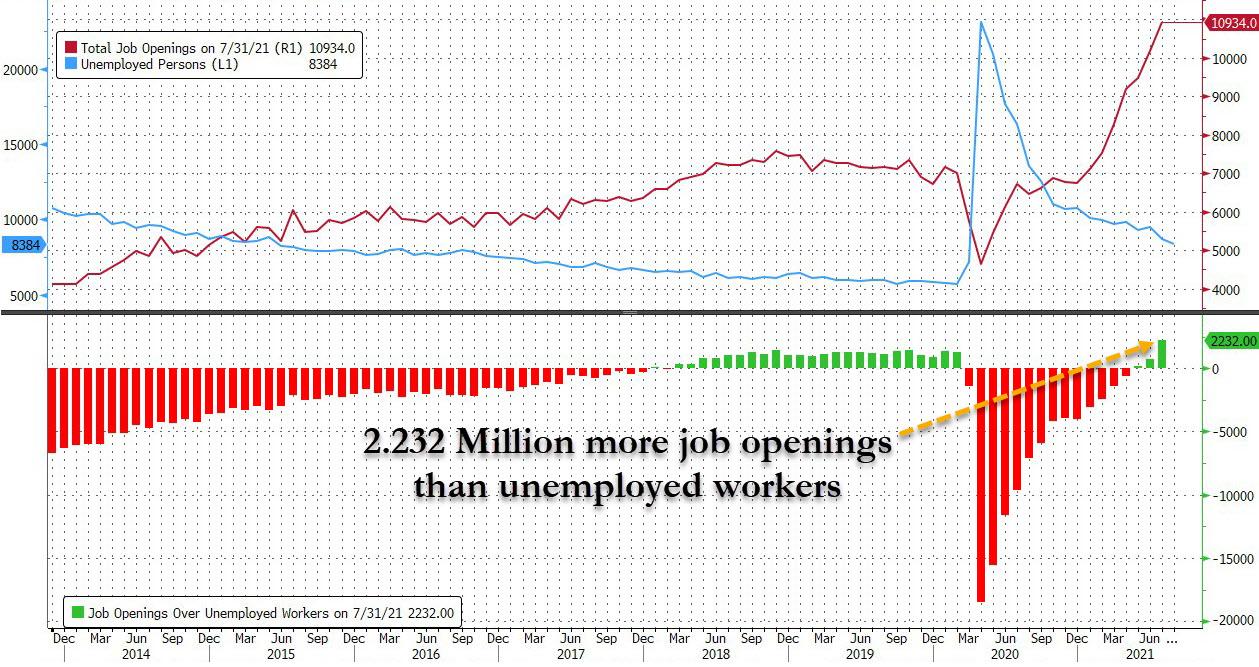
Adding to that the insanity, as ZeroHege called it, that there are now a record 2.2 million more job openings than unemployed workers, makes you scratch your head wondering what kind of an upside-down world we are living in.
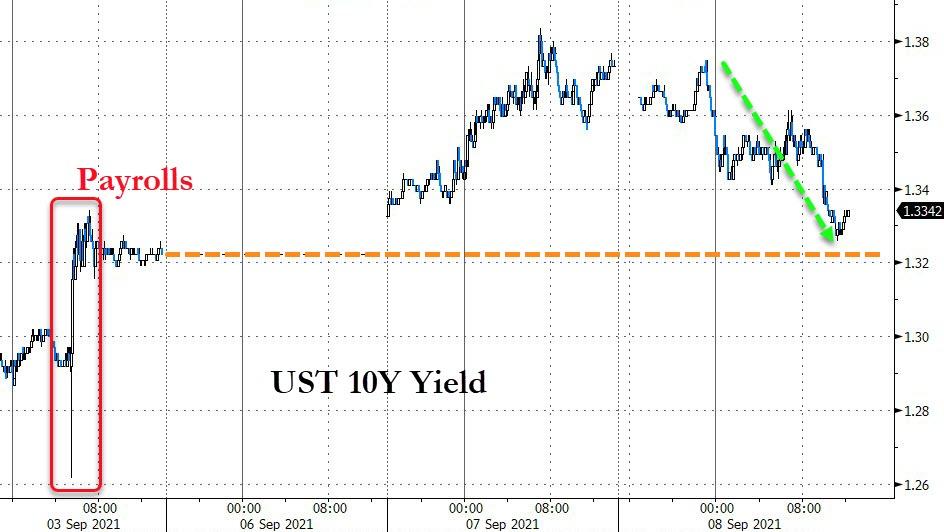
Bonds did well, with yields dropping, as the 10-year auction went better than expected with their yield moving back to unchanged for the week.
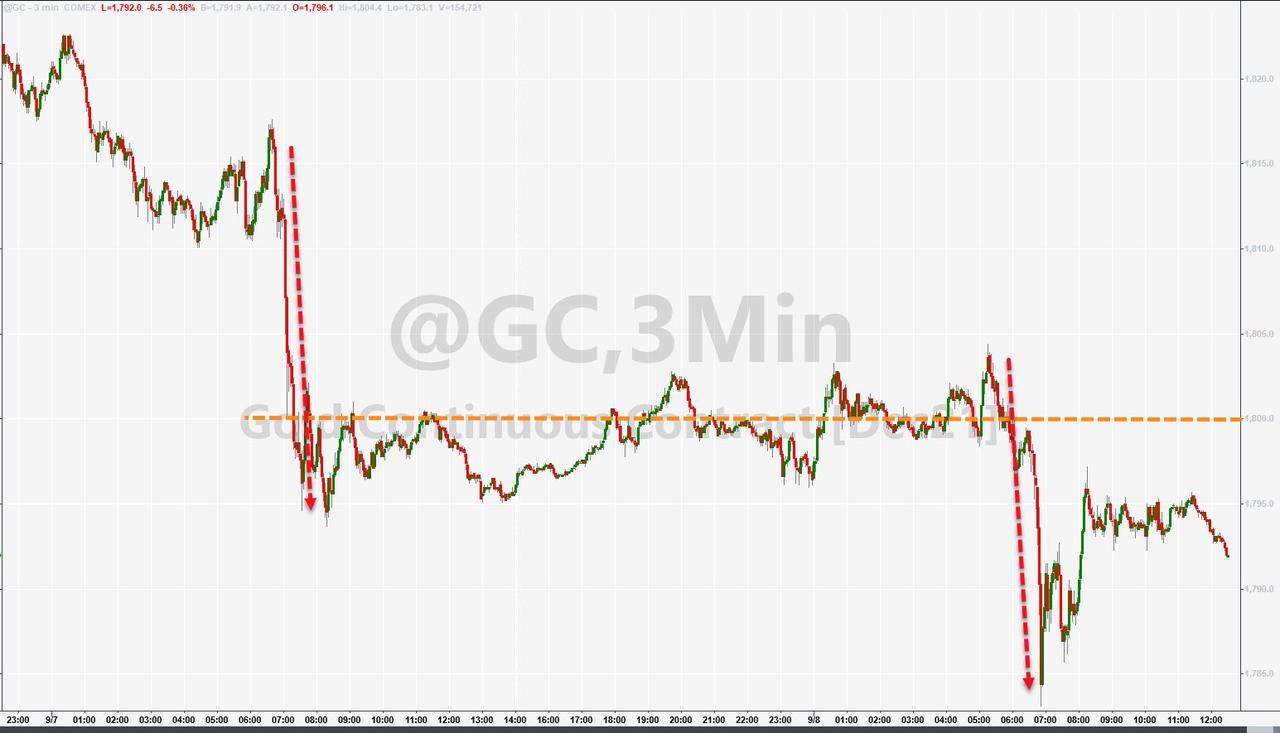
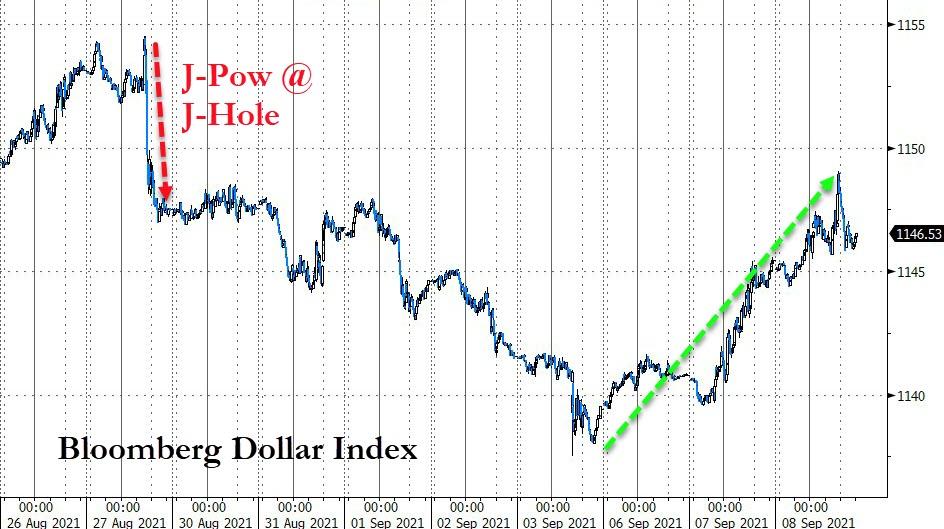
That should have given Gold an assist, but it was prevented by the US Dollar continuing to surge mid-session but giving up some of its gains at the close.
In the end, the losses for the major indexes were minor, but it remains unclear whether there is more downside to come. Your guess is as good as mine.
2. ETFs in the Spotlight
In case you missed the announcement and description of this section, you can read it here again.
It features some of the 10 broadly diversified domestic and sector ETFs from my HighVolume list as posted every Saturday. Furthermore, they are screened for the lowest MaxDD% number meaning they have been showing better resistance to temporary sell offs than all others over the past year.
The below table simply demonstrates the magnitude with which these ETFs are fluctuating above or below their respective individual trend lines (%+/-M/A). A break below, represented by a negative number, shows weakness, while a break above, represented by a positive percentage, shows strength.
For hundreds of ETF choices, be sure to reference Thursday’s StatSheet.
For this current domestic “Buy” cycle, here’s how some our candidates have fared:
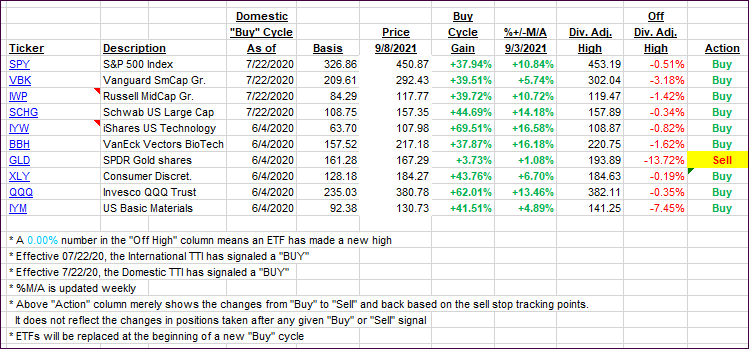
Click image to enlarge.
Again, the %+/-M/A column above shows the position of the various ETFs in relation to their respective long-term trend lines, while the trailing sell stops are being tracked in the “Off High” column. The “Action” column will signal a “Sell” once the -8% point has been taken out in the “Off High” column. For more volatile sector ETFs, the trigger point is -10%.
3. Trend Tracking Indexes (TTIs)
Our TTIs slipped again, as the bears were in charge of market direction for the 3rd day.
This is how we closed 09/08/2021:
Domestic TTI: +8.76% above its M/A (prior close +8.83%)—Buy signal effective 07/22/2020.
International TTI: +5.46% above its M/A (prior close +6.05%)—Buy signals effective 07/22/2020.
Disclosure: I am obliged to inform you that I, as well as my advisory clients, own some of the ETFs listed in the above table. Furthermore, they do not represent a specific investment recommendation for you, they merely show which ETFs from the universe I track are falling within the specified guidelines.
All linked charts above are courtesy of Bloomberg via ZeroHedge.
Contact Ulli