
- Moving the markets
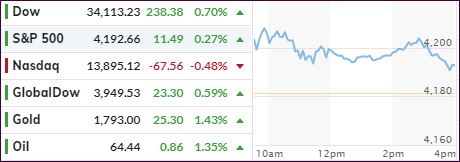
The major indexes, except for the Nasdaq, continued last month’s bullish theme on the first trading day of May by vacillating above their respective unchanged lines, as the Dow led with a 0.70% gain.
With the continual reopening of the economy retailers benefited, also supported by New York Gov Cuomo’s announcement that most capacity restrictions will be lifted across NY, NJ, and CT with 24-hour subway service in NY City to resume later this month.
Traders now are worried about the truism of the adage “sell in May and go away,” which CNBC explained like this:
Data going back to 1928 shows that the May-October period has the lowest average and median returns of any six-month period of the year with the S&P 500 up 66% of the time on an average return of 2.2%, according to Bank of America.
However, right now another busy earnings week is on deck with much attention being given to Friday’s widely watched and eagerly expected jobs report.
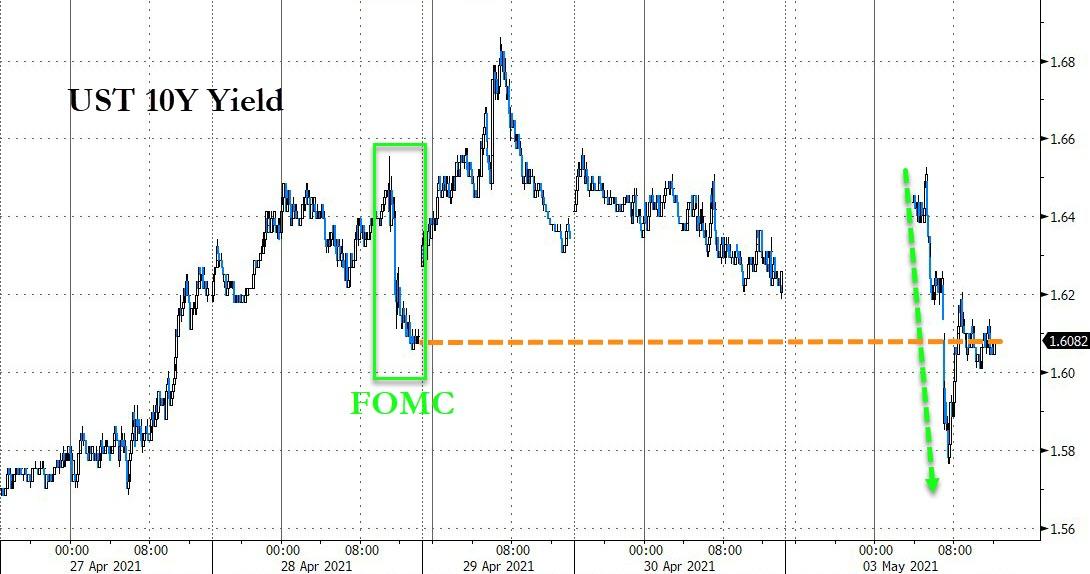
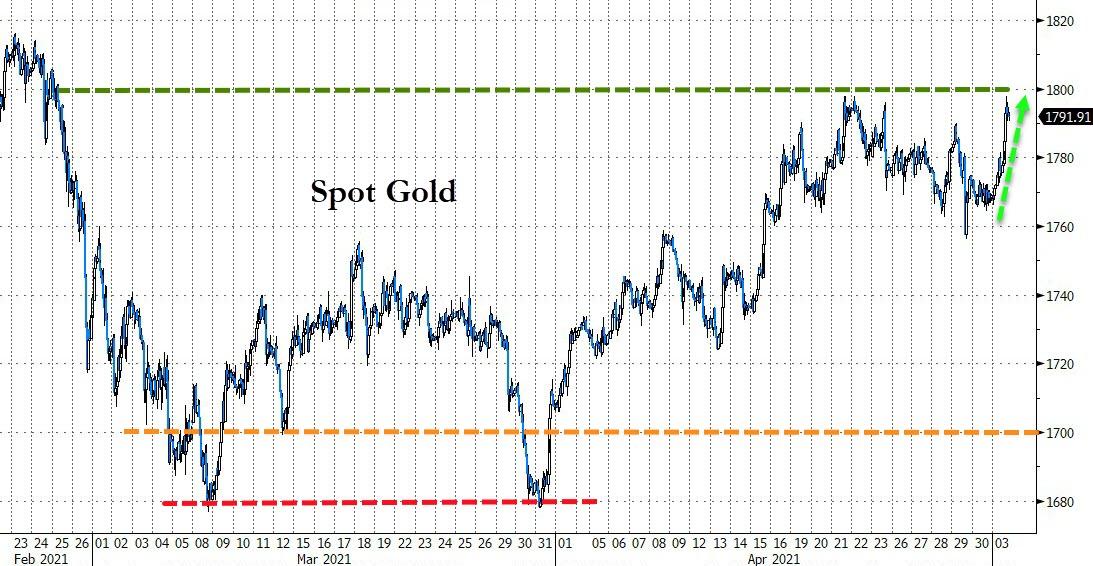
The US Dollar tanked, while 10-year bond yield followed suit by breaking back below its 1.60% level, both of which are the ideal combination to push Gold higher. Today was no exception, and the precious metal rallied 1.39% stopping just short of its $1,800 level.
With inflationary fears rising, it came as no surprise that the Commodity index surged adding some 1.12% in the process and continuing its ascent to higher prices.
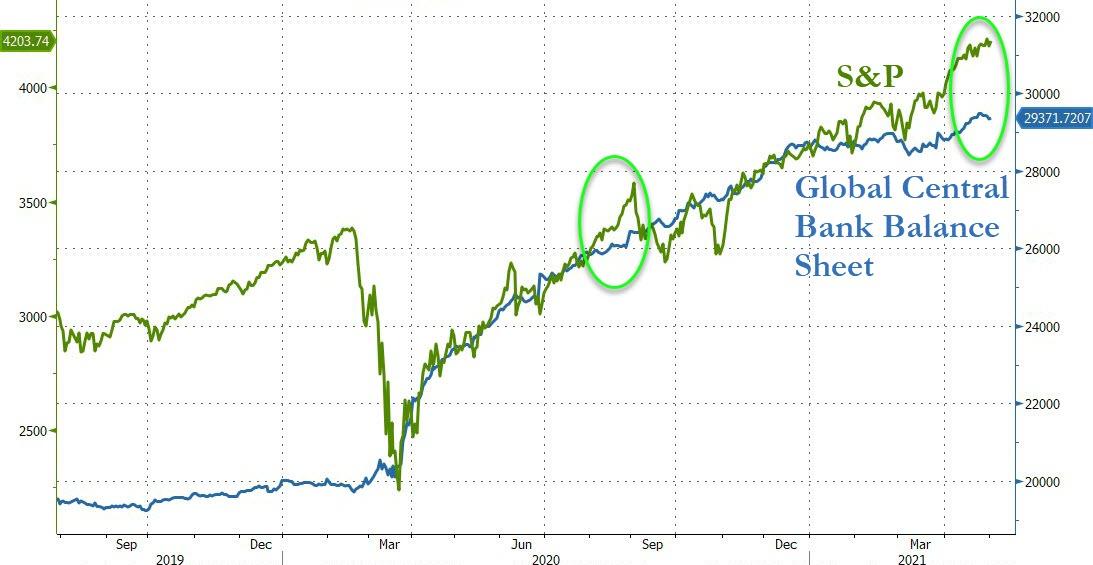
ZeroHedge, in its infinite and spot on wisdom proposed that we need a bigger global balance sheet, as Bloomberg charts here, or dire consequences, like a slipping market, may be on the horizon.
2. ETFs in the Spotlight
In case you missed the announcement and description of this section, you can read it here again.
It features some of the 10 broadly diversified domestic and sector ETFs from my HighVolume list as posted every Saturday. Furthermore, they are screened for the lowest MaxDD% number meaning they have been showing better resistance to temporary sell offs than all others over the past year.
The below table simply demonstrates the magnitude with which these ETFs are fluctuating above or below their respective individual trend lines (%+/-M/A). A break below, represented by a negative number, shows weakness, while a break above, represented by a positive percentage, shows strength.
For hundreds of ETF choices, be sure to reference Thursday’s StatSheet.
For this current domestic “Buy” cycle, here’s how some our candidates have fared:
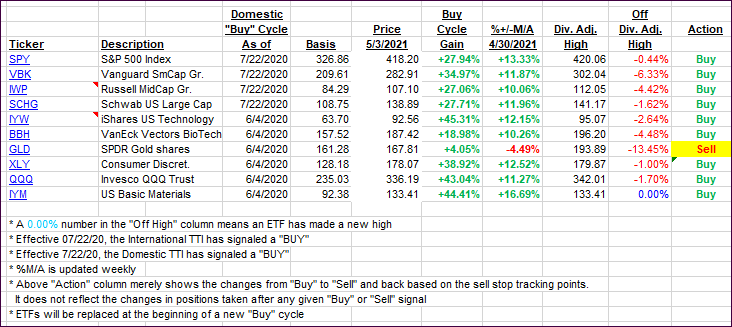
Click image to enlarge.
Again, the %+/-M/A column above shows the position of the various ETFs in relation to their respective long-term trend lines, while the trailing sell stops are being tracked in the “Off High” column. The “Action” column will signal a “Sell” once the -8% point has been taken out in the “Off High” column. For more volatile sector ETFs, the trigger point is -10%.
3. Trend Tracking Indexes (TTIs)
Our TTIs climbed higher as the bullish theme prevailed.
This is how we closed 05/03/2021:
Domestic TTI: +19.46% above its M/A (prior close +18.76%)—Buy signal effective 07/22/2020.
International TTI: +15.50% above its M/A (prior close +14.77%)—Buy signals effective 07/22/2020.
Disclosure: I am obliged to inform you that I, as well as my advisory clients, own some of the ETFs listed in the above table. Furthermore, they do not represent a specific investment recommendation for you, they merely show which ETFs from the universe I track are falling within the specified guidelines.
Contact Ulli