
- Moving the markets
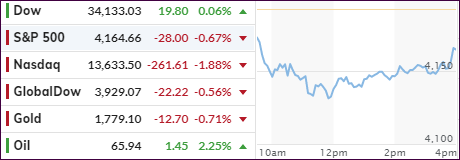
After yesterday’s strong bullish bounce into May, the picture looked anything but warm and fuzzy this morning, when the major dropped sharply but managed to rebound off their lows, however, only the Dow climbed back into the green.
The Nasdaq had its worst day since March, as fears of rising inflation, concerns of higher bond yields as well as the Biden administration’s potential tax hikes extracted their pound of flesh from the tech sector.
It was none other than Treasury Secretary and former Fed head Janet Yellen, who put the bulls on notice that changes might be forthcoming. Here are her highlights:
“It may be that interest rates will have to rise a little bit to make sure our economy doesn’t overheat.”
“We’ve gone for way too long letting long-term problems fester in our economy.”
Ouch! That was enough to send the markets reeling, and— stocks puked as one would expect at the first signs of the punchbowl being taken away…as ZeroHedge commented so eloquently.
That was followed up by another bon mot, namely: We wonder what Jay Powell will have to say about Janet stepping on his toes? Did she just start the process of thinking about thinking about thinking about normalization?
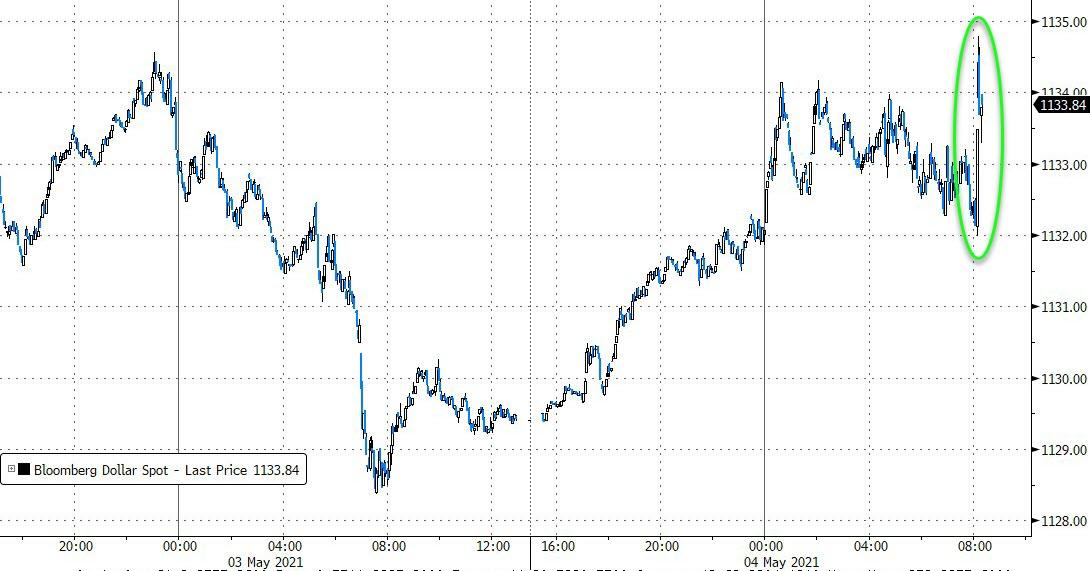
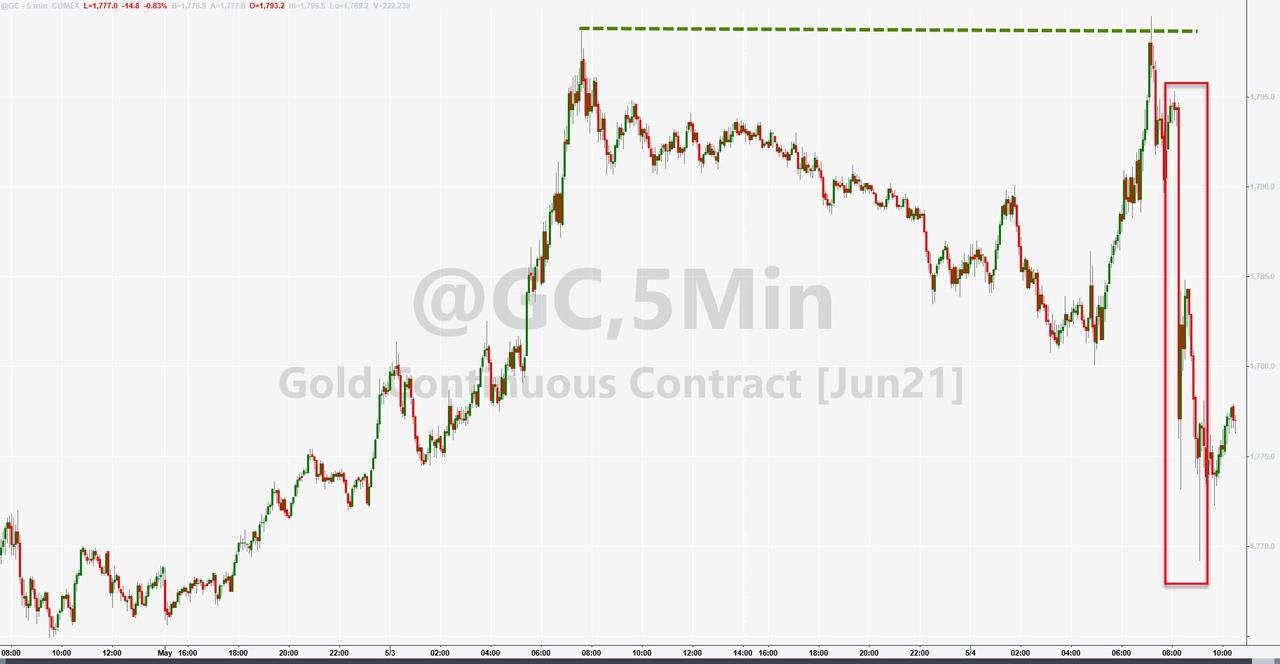
Tongue in cheek comments aside, the US Dollar jumped after Yellen’s remarks, which demolished Gold’s early gains and pushed the precious metal back into the red. Value outperformed Growth with RPV storming back into the green during the afternoon recovery.
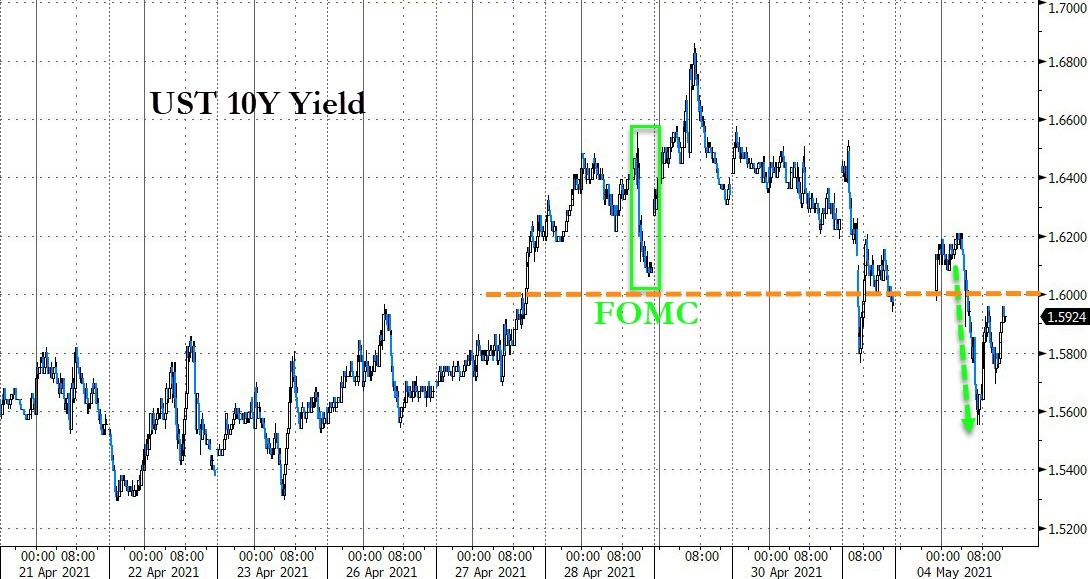
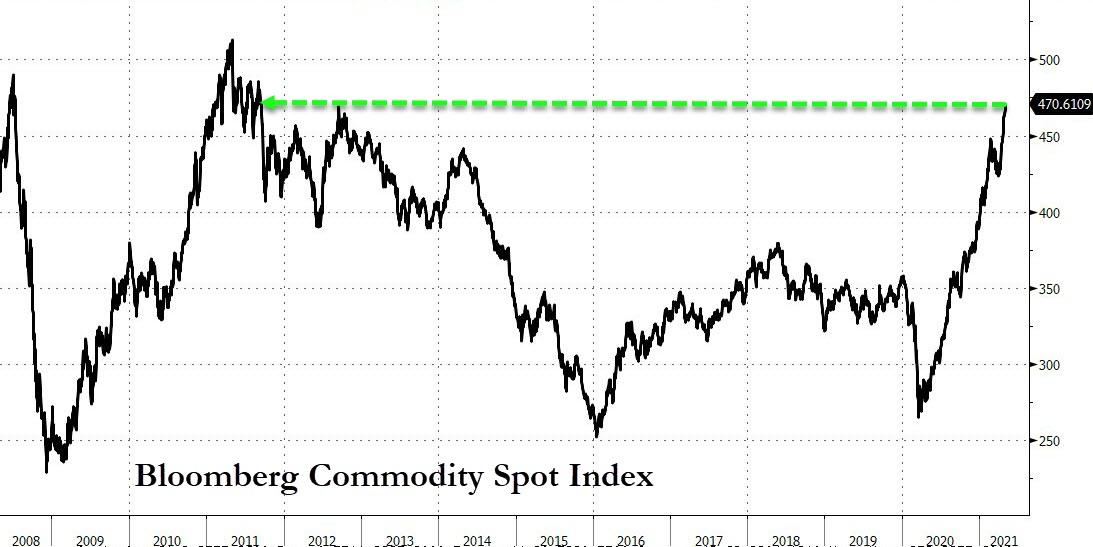
The 10-year bond yield chopped around aimlessly but ended up below the 1.6% level. For sure, as I have commented on may occasions, inflation is a concern and you only need to look at trend of the Commodity Index, which continued its rise to the highest since 2011, as ZH pointed out.
And again, via ZH, Bloomberg updated the Global Liquidity Proxy, which shows that, absent of further stimulus, the S&P 500 may drop but find support around the 3,900 level.
2. ETFs in the Spotlight
In case you missed the announcement and description of this section, you can read it here again.
It features some of the 10 broadly diversified domestic and sector ETFs from my HighVolume list as posted every Saturday. Furthermore, they are screened for the lowest MaxDD% number meaning they have been showing better resistance to temporary sell offs than all others over the past year.
The below table simply demonstrates the magnitude with which these ETFs are fluctuating above or below their respective individual trend lines (%+/-M/A). A break below, represented by a negative number, shows weakness, while a break above, represented by a positive percentage, shows strength.
For hundreds of ETF choices, be sure to reference Thursday’s StatSheet.
For this current domestic “Buy” cycle, here’s how some our candidates have fared:
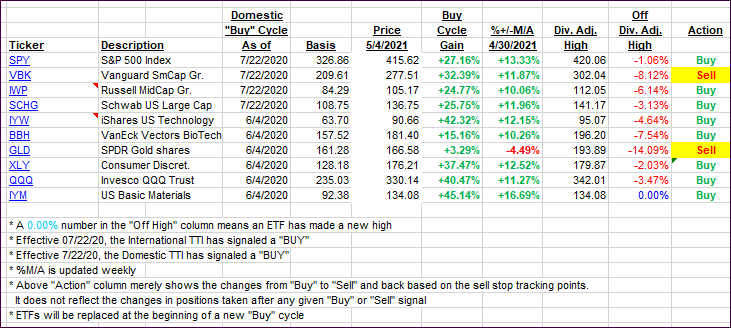
Click image to enlarge.
Again, the %+/-M/A column above shows the position of the various ETFs in relation to their respective long-term trend lines, while the trailing sell stops are being tracked in the “Off High” column. The “Action” column will signal a “Sell” once the -8% point has been taken out in the “Off High” column. For more volatile sector ETFs, the trigger point is -10%.
3. Trend Tracking Indexes (TTIs)
Our TTIs slipped a tad, as the major indexes staged an afternoon rebound thereby reducing some of the early morning losses.
This is how we closed 05/04/2021:
Domestic TTI: +19.33% above its M/A (prior close +19.46%)—Buy signal effective 07/22/2020.
International TTI: +14.90% above its M/A (prior close +15.50%)—Buy signals effective 07/22/2020.
Disclosure: I am obliged to inform you that I, as well as my advisory clients, own some of the ETFs listed in the above table. Furthermore, they do not represent a specific investment recommendation for you, they merely show which ETFs from the universe I track are falling within the specified guidelines.
Contact Ulli