
- Moving the markets
Supporting the initial comeback bounce in the markets was Treasury Secretary Yellen, who completely reversed her hawkish talk on interest rates.
ZeroHedge presented it this way:
“Let me be clear it’s not something I’m predicting or recommending,” Yellen says about rates, flip-flopping her earlier perspective entirely.
Then she addressed the issue of inflation, toeing the establishment line that it will be “transitory” for the next six months or so…
She added that if there is an inflation problem, she is certain the Federal Reserve can be counted on to address it.
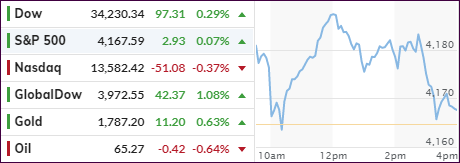
That’s all it took to pull the major indexes out of the basement and into green territory, at least early on and before the roller coaster ride opened up. Supporting actors were strong earnings results and general optimism, but they did not help the Nasdaq to return above its unchanged line.
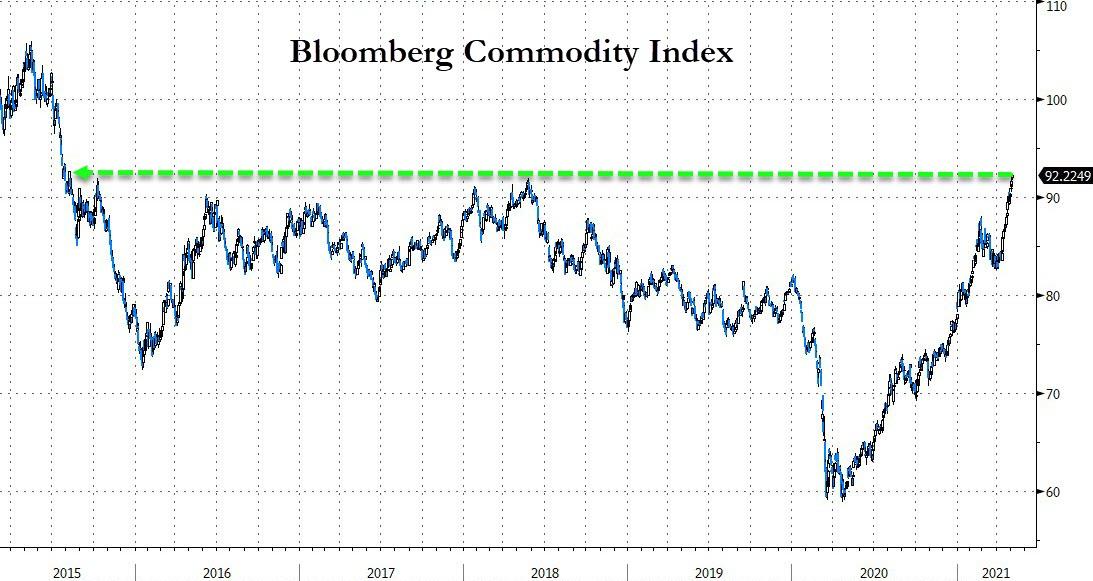
Volatility picked up in part due to inflationary forces being hard at work, with the Bloomberg Commodity Index adding another up day, it’s 16th straight and the highest level since 2015. However, keep in mind that the Fed considers this “transitory,” though they are living under the illusion that they are equipped to control accelerating prices.
A major sell program kicked in later in the session and took the starch out of upward momentum, just about the time as the Biden administration supported the waiver on Covid vaccine-patents at the WTO, as ZH pointed out.
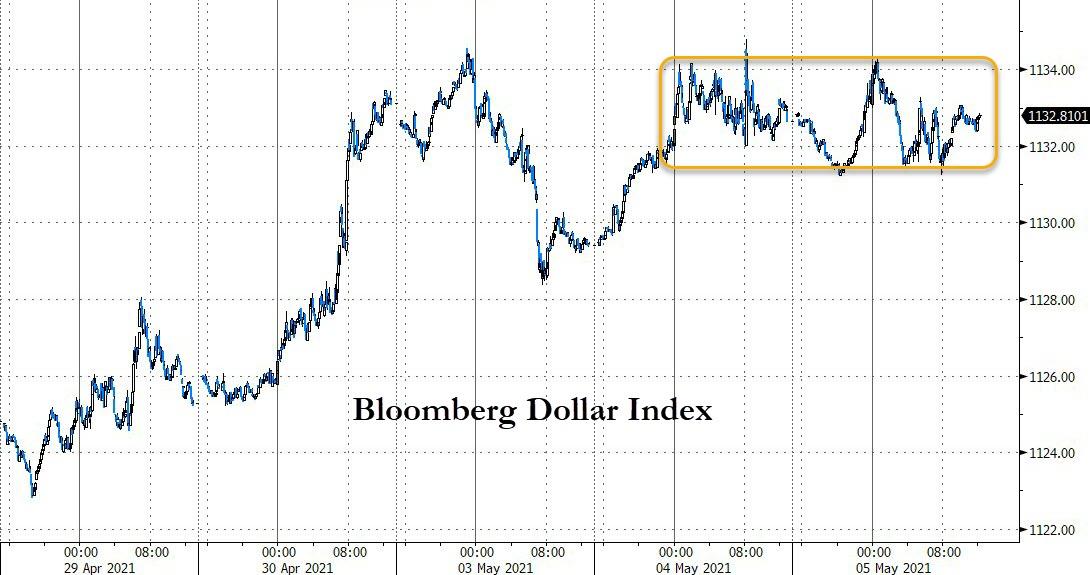
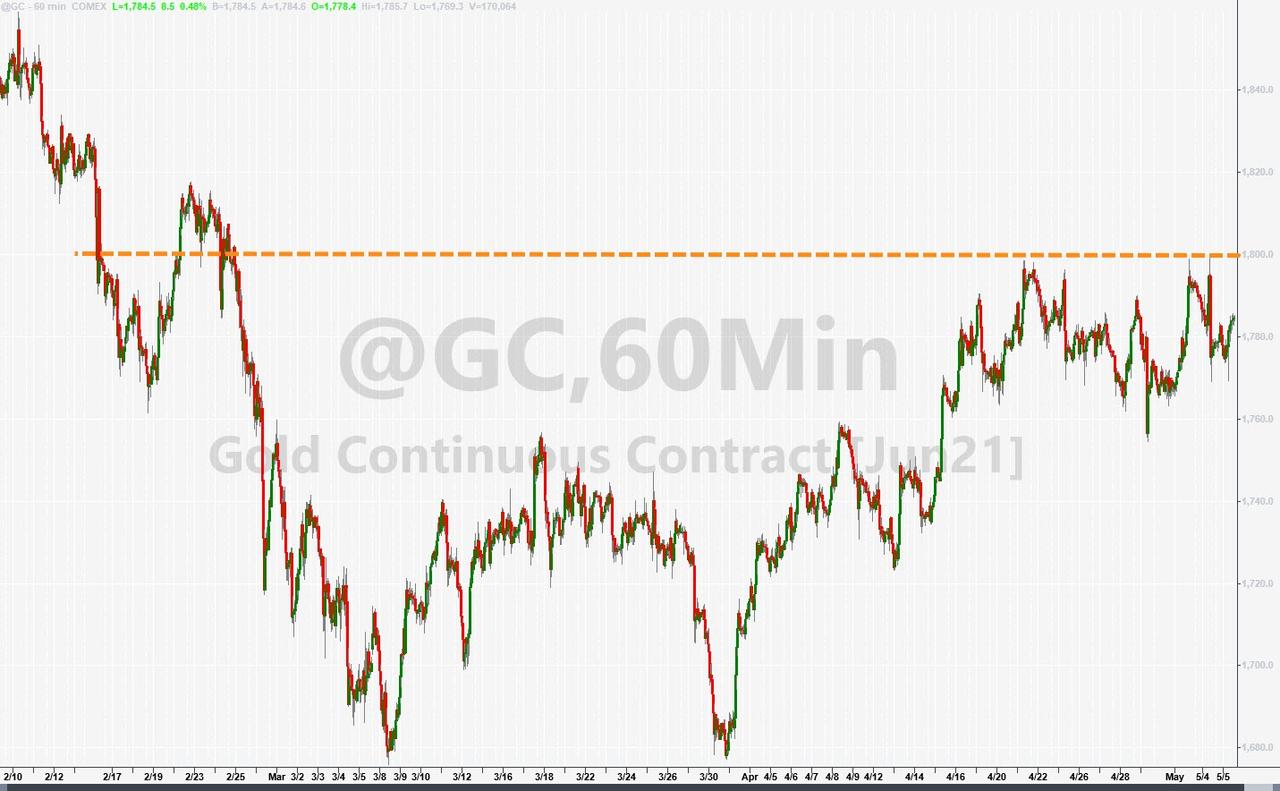
Bond yields spiked initially above the 1.6% level but sold off into the close dropping to 1.57%. The US Dollar trod water all day and traded in a tight range, while Gold managed to eke out a small gain but was unable to conquer its $1,800 level.
And, as we have seen lately, “value” outperformed “growth.”
2. ETFs in the Spotlight
In case you missed the announcement and description of this section, you can read it here again.
It features some of the 10 broadly diversified domestic and sector ETFs from my HighVolume list as posted every Saturday. Furthermore, they are screened for the lowest MaxDD% number meaning they have been showing better resistance to temporary sell offs than all others over the past year.
The below table simply demonstrates the magnitude with which these ETFs are fluctuating above or below their respective individual trend lines (%+/-M/A). A break below, represented by a negative number, shows weakness, while a break above, represented by a positive percentage, shows strength.
For hundreds of ETF choices, be sure to reference Thursday’s StatSheet.
For this current domestic “Buy” cycle, here’s how some our candidates have fared:
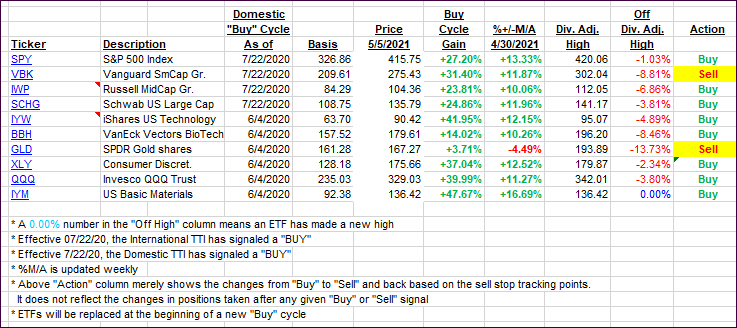
Click image to enlarge.
Again, the %+/-M/A column above shows the position of the various ETFs in relation to their respective long-term trend lines, while the trailing sell stops are being tracked in the “Off High” column. The “Action” column will signal a “Sell” once the -8% point has been taken out in the “Off High” column. For more volatile sector ETFs, the trigger point is -10%.
3. Trend Tracking Indexes (TTIs)
Our TTIs both gained with the International one outperforming its domestic cousin.
This is how we closed 05/05/2021:
Domestic TTI: +19.57% above its M/A (prior close +19.33%)—Buy signal effective 07/22/2020.
International TTI: +16.18% above its M/A (prior close +14.90%)—Buy signals effective 07/22/2020.
Disclosure: I am obliged to inform you that I, as well as my advisory clients, own some of the ETFs listed in the above table. Furthermore, they do not represent a specific investment recommendation for you, they merely show which ETFs from the universe I track are falling within the specified guidelines.
Contact Ulli