
ETF Tracker StatSheet
You can view the latest version here.
STRUGGLING TO MAINTAIN ALTITUDE
- Moving the markets
Despite some analysts’ expectations for a sharp increase in volatility due to options expirations today, where anything is possible, this session turned out to be better than expected.
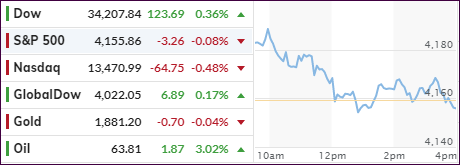
The major indexes opened higher but slowly lost their upside momentum throughout the day with the Nasdaq faring the worst, while the Dow ended up in the green and the S&P 500 more or less stuck to its unchanged line.
In the end, even though we saw another wild ride in the market, the losses were minor with the S&P 500 surrendering 0.4% for the week.
Helping the overall positive sentiment was a gauge for US Manufacturing, which surged to a record high, however, offsetting the good news was an unexpected tumble in Existing Home Sales for April, which missed expectations dramatically. But prices continued to soar.
Here’s how ZeroHedge saw today’s news cycle:
1015ET *CHINA REITERATES CALL FOR CRACKDOWN ON BITCOIN MINING, TRADING (slamming crypto and pushed the entire stock market lower too)
1205ET *HARKER: SHOULD SPEAK ABOUT REDUCING BOND BUYS SOONER THAN LATER (pushed S&P down to unchanged)
1220ET *BOSTIC: MONITORING ECONOMY TO ASSESS TRANSITORY VS OTHERWISE (thanks Captain Obvious)
1225ET *KAPLAN: SHOULD DISCUSS UNINTENDED EFFECTS OF EMERGENCY TOOLS (little late for that now?)
1225ET *BARKIN: WHEN WE MAKE SUBSTANTIAL FURTHER PROGRESS, WE’LL TAPER (yada yada yada)
1250ET *KAPLAN: RATHER GENTLY TAKE FOOT OFF ACCELERATOR THAN BRAKE LATER (so tapering then?)
1345ET *KAPLAN DECLINES TO PUT DATE ON WHEN FED SHOULD START TAPER TALK
1430ET *WHITE HOUSE SAYS INFRASTRUCTURE COUNTEROFFER REDUCES PRICE TAG TO $1.7T (spooked stocks a little)
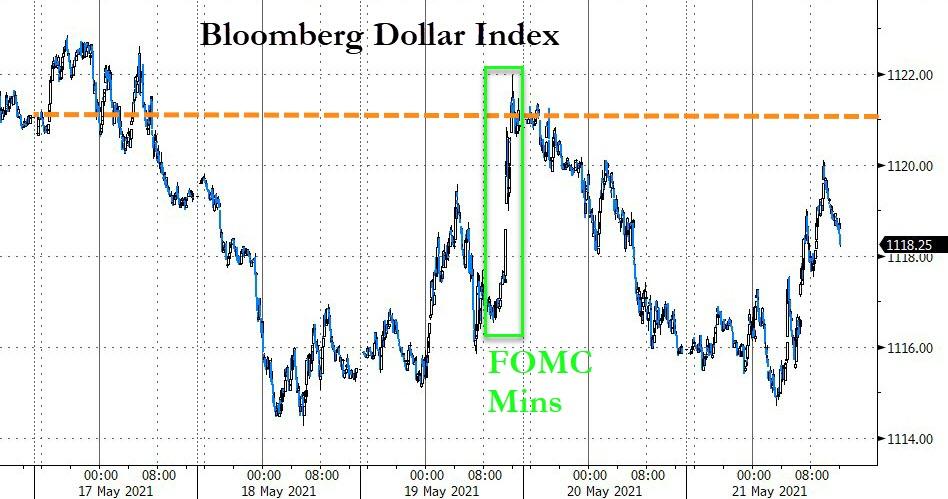
The US Dollar index bounced off its lows and ended the week slightly lower, while 10-year bond yields dipped back below the 1.62% level. Gold bobbled around aimlessly with its ETF GLD eking out a tiny gain of 0.05%. Showing a far better return was the value ETF RPV, which added another 0.77%.
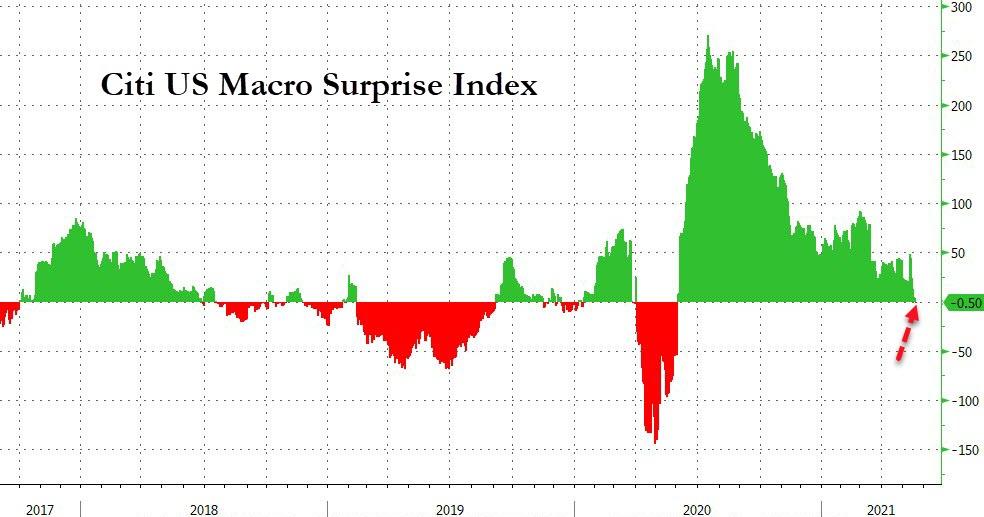
Is the economy really improving as much as some cheerleaders seem to think? If you look at the Citi US Macro Surprise Index, it’s questionable, because this indicator just dipped into the red for first time since June 2020.
2. ETFs in the Spotlight
In case you missed the announcement and description of this section, you can read it here again.
It features some of the 10 broadly diversified domestic and sector ETFs from my HighVolume list as posted every Saturday. Furthermore, they are screened for the lowest MaxDD% number meaning they have been showing better resistance to temporary sell offs than all others over the past year.
The below table simply demonstrates the magnitude with which these ETFs are fluctuating above or below their respective individual trend lines (%+/-M/A). A break below, represented by a negative number, shows weakness, while a break above, represented by a positive percentage, shows strength.
For hundreds of ETF choices, be sure to reference Thursday’s StatSheet.
For this current domestic “Buy” cycle, here’s how some our candidates have fared:
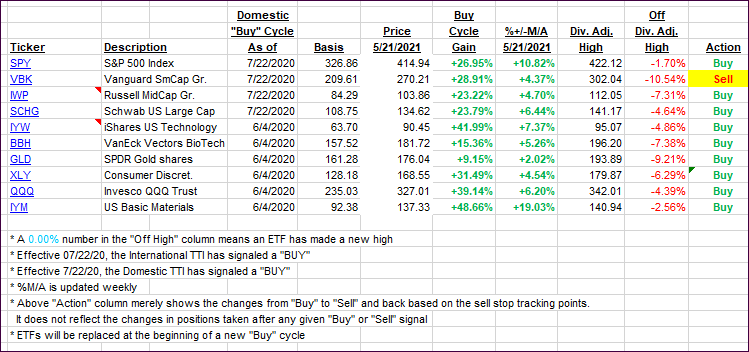
Click image to enlarge.
Again, the %+/-M/A column above shows the position of the various ETFs in relation to their respective long-term trend lines, while the trailing sell stops are being tracked in the “Off High” column. The “Action” column will signal a “Sell” once the -8% point has been taken out in the “Off High” column. For more volatile sector ETFs, the trigger point is -10%.
3. Trend Tracking Indexes (TTIs)
Our TTIs slipped with the major indexes closing the week more or less flat.
This is how we closed 05/21/2021:
Domestic TTI: +16.60% above its M/A (prior close +17.42%)—Buy signal effective 07/22/2020.
International TTI: +15.00% above its M/A (prior close +15.71%)—Buy signals effective 07/22/2020.
Disclosure: I am obliged to inform you that I, as well as my advisory clients, own some of the ETFs listed in the above table. Furthermore, they do not represent a specific investment recommendation for you, they merely show which ETFs from the universe I track are falling within the specified guidelines.
All linked charts above are courtesy of Bloomberg via ZeroHedge.
———————————————————-
WOULD YOU LIKE TO HAVE YOUR INVESTMENTS PROFESSIONALLY MANAGED?
Do you have the time to follow our investment plans yourself? If you are a busy professional who would like to have his portfolio managed using our methodology, please contact me directly or get more details here.
———————————————————
Back issues of the ETF Tracker are available on the web.
Contact Ulli