
- Moving the markets
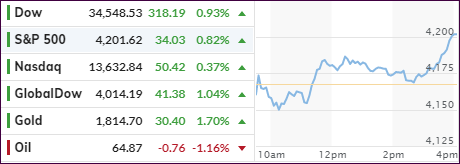
Early weakness gave way to a mid-day pump, which was followed by a date session rip with all three major indexes closing in the green. The laggard again was the Nasdaq, as “value” continued outperform “growth.” YTD, the Russell 1000 Value index has gained 17%, while the Russell 1000 Growth Index shows only a meager 5%.
It seemed like traders were front running tomorrow’s jobs report, which is highly anticipated due to its representation of the labor market recovery. If today’s much improved weekly Initial Jobless Claims, which dropped to a pandemic low of 498k vs. expectations of 527k, is any indication, we might be in for a surprise. Despite today’s encouraging improvement, keep in mind that over 16 million Americans remain “on the dole.”
“Today’s read is another proof point that we’re one step closer to full economic recovery, sooner than some may have expected,” said Mike Loewengart, managing director of investment strategy at E-Trade Financial. “As we see some serious momentum building on the jobs front, all eyes will be on how this plays into action taken by the Fed, if any.”
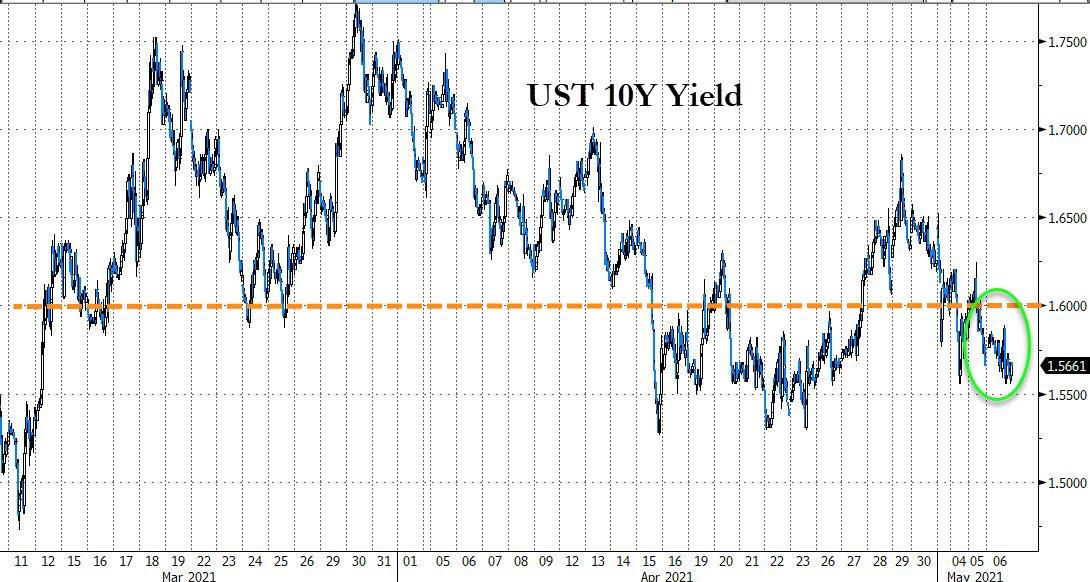
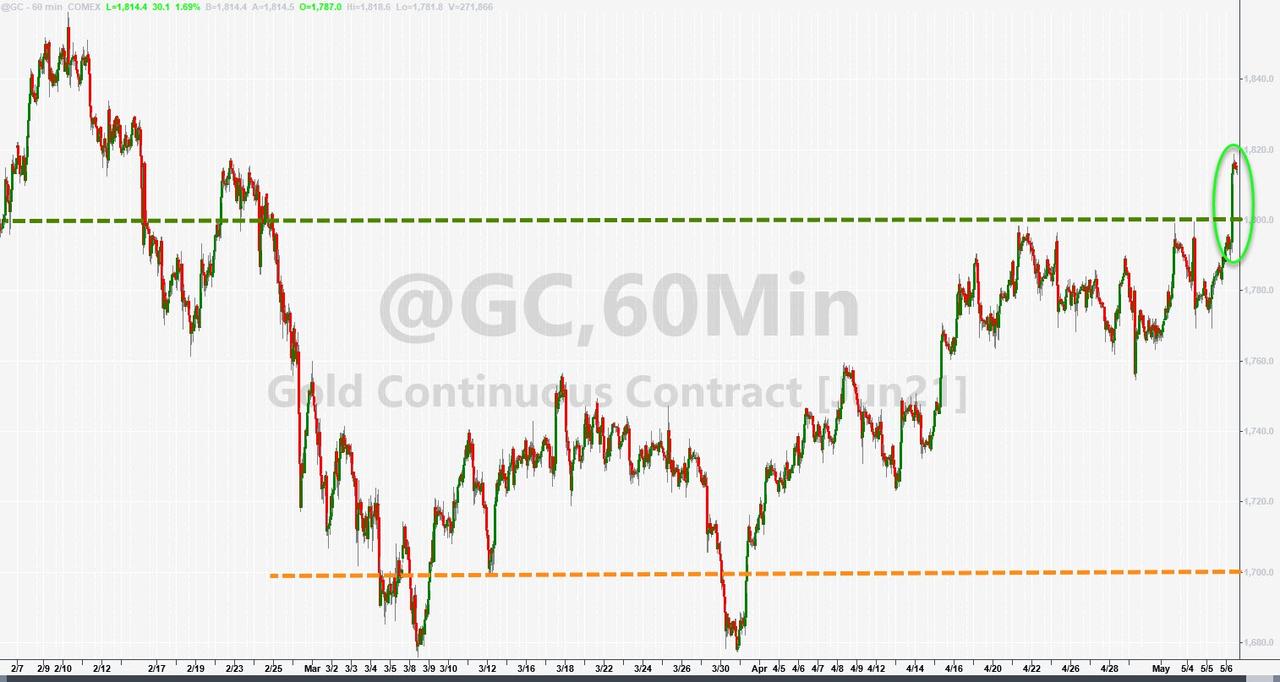
Bond yields were in retreat mode with the 10-year holding steady below the 1.6% mark, while the US Dollar did its best imitation of a swan dive, as Bloomberg demonstrates in this chart. This combination did wonders for Gold, which surged 1.7% and finally recaptured its $1,800 level.
We will now have to wait and see if tomorrow’s jobs report can indeed live up to these high expectations, or if we will be witnessing the old standby routine, namely “buy the rumor, sell the fact.”
2. ETFs in the Spotlight
In case you missed the announcement and description of this section, you can read it here again.
It features some of the 10 broadly diversified domestic and sector ETFs from my HighVolume list as posted every Saturday. Furthermore, they are screened for the lowest MaxDD% number meaning they have been showing better resistance to temporary sell offs than all others over the past year.
The below table simply demonstrates the magnitude with which these ETFs are fluctuating above or below their respective individual trend lines (%+/-M/A). A break below, represented by a negative number, shows weakness, while a break above, represented by a positive percentage, shows strength.
For hundreds of ETF choices, be sure to reference Thursday’s StatSheet.
For this current domestic “Buy” cycle, here’s how some our candidates have fared:
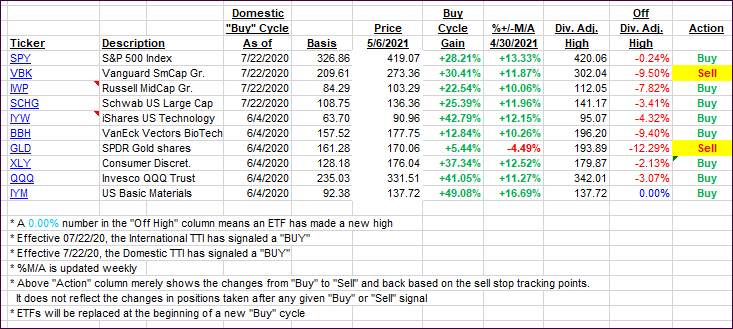
Click image to enlarge.
Again, the %+/-M/A column above shows the position of the various ETFs in relation to their respective long-term trend lines, while the trailing sell stops are being tracked in the “Off High” column. The “Action” column will signal a “Sell” once the -8% point has been taken out in the “Off High” column. For more volatile sector ETFs, the trigger point is -10%.
3. Trend Tracking Indexes (TTIs)
Our TTIs both headed north as the rebound was broad based.
This is how we closed 05/06/2021:
Domestic TTI: +20.18% above its M/A (prior close +19.57%)—Buy signal effective 07/22/2020.
International TTI: +17.40% above its M/A (prior close +16.18%)—Buy signals effective 07/22/2020.
Disclosure: I am obliged to inform you that I, as well as my advisory clients, own some of the ETFs listed in the above table. Furthermore, they do not represent a specific investment recommendation for you, they merely show which ETFs from the universe I track are falling within the specified guidelines.
Contact Ulli