
- Moving the markets
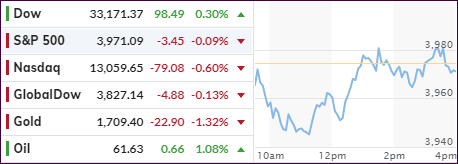
Despite the major indexes climbing again out of an initial hole, with the Dow back above its unchanged line, markets were shaken up early on.
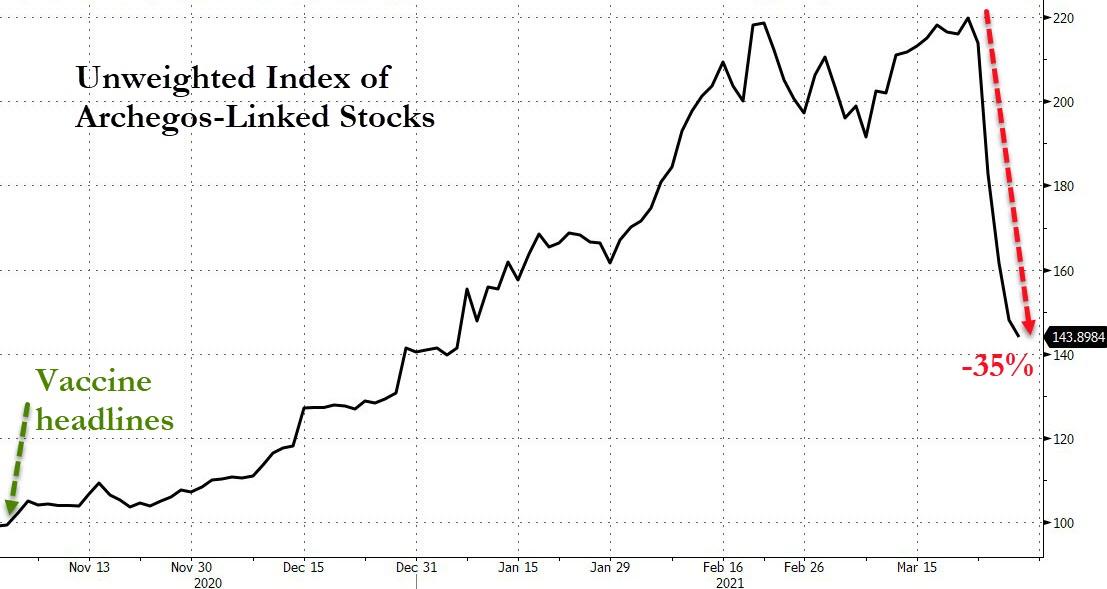
The culprit was news about the multibillion-dollar family office of Archegos Capital Management, which was faced with a margin call forcing them to liquidate massive holdings in stocks and causing prices to plunge.
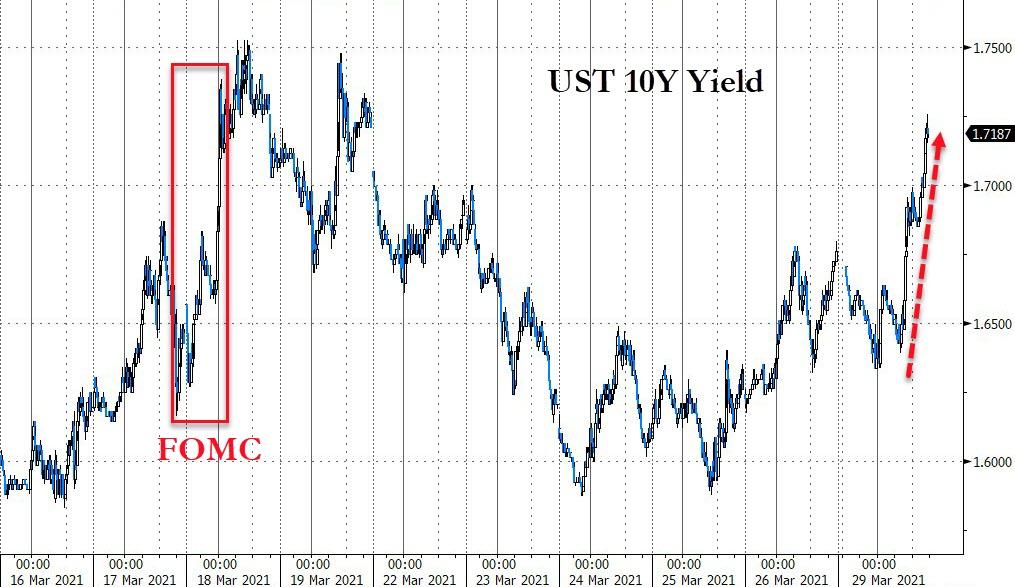
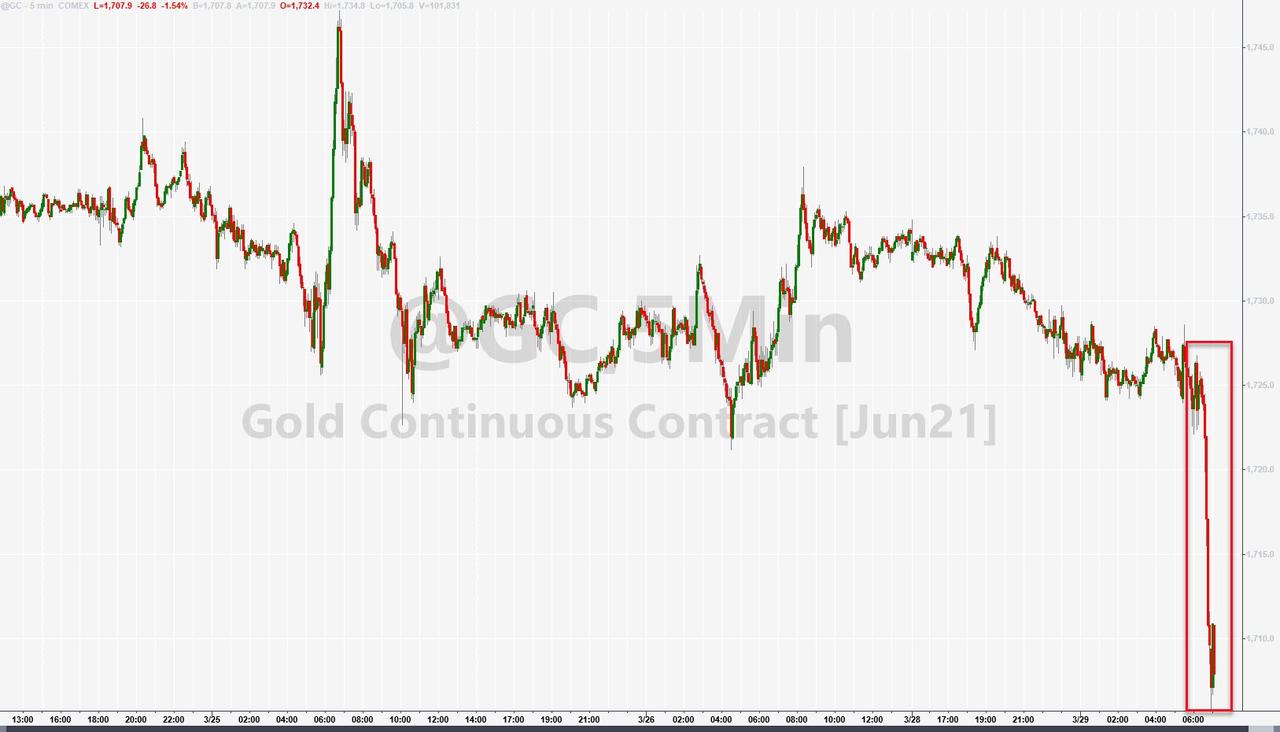
Of course, the immediate question was as to who else might be in trouble, which was left unanswered, at least for the time being. US bond yields shot up and gold was getting hammered, as uncertainty reigned.
Not adding anything positive to the already sour mood was this bon mot from MarketWatch:
Credit Suisse shares tumbled 13% as the bank warned it would face a “significant” hit to its first-quarter results due to the bank having to exit hedge fund positions related to the forced selling. Nomura also warned that it could get hit, sending its shares down nearly 15%.
Translated, that means there is never just one cockroach, and we’ll have to wait and see how this plays out and if other entities, yet to be named, may have been caught in that predicament. Whether the ultimate fallout is contained remains the big unknown.
Despite the effort to pull the major indexes out of the doldrums, the S&P fell slightly short, but the Nasdaq remained in the red.
Taking the brunt of the beating were SmallCaps, which we no longer own, and both varieties, growth, and value, were pummeled with the former sinking some 3%.
So far, in March it’s been a tale of two markets with the tech sector slightly in the red, while the Dow and S&P 500 have risen 6.9% and 4.3% respectively.
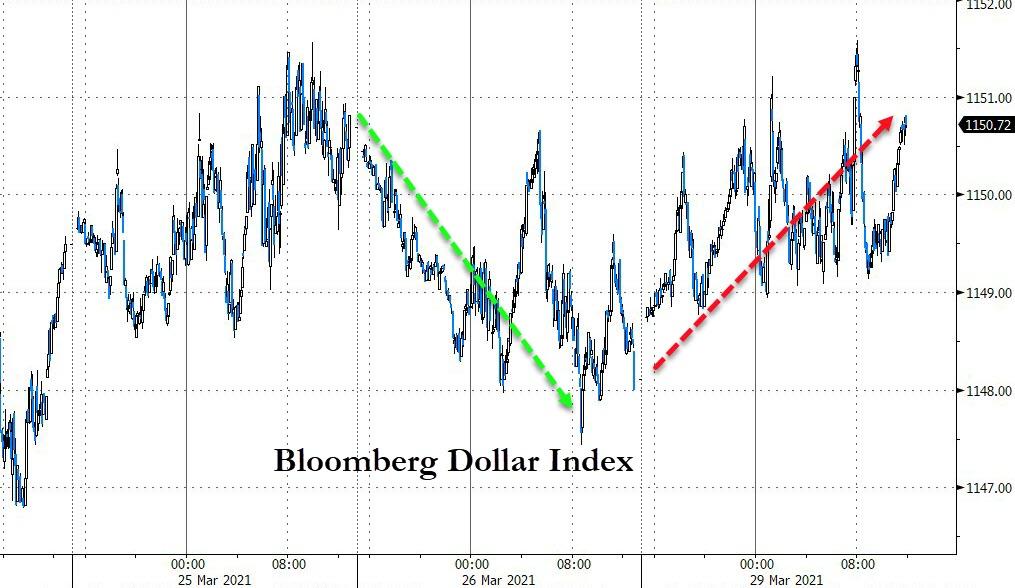
The US Dollar was slashing around aimlessly and ended marginally higher, while not contributing any warm and fuzzy feelings to this nutty market environment.
2. ETFs in the Spotlight
In case you missed the announcement and description of this section, you can read it here again.
It features some of the 10 broadly diversified domestic and sector ETFs from my HighVolume list as posted every Saturday. Furthermore, they are screened for the lowest MaxDD% number meaning they have been showing better resistance to temporary sell offs than all others over the past year.
The below table simply demonstrates the magnitude with which these ETFs are fluctuating above or below their respective individual trend lines (%+/-M/A). A break below, represented by a negative number, shows weakness, while a break above, represented by a positive percentage, shows strength.
For hundreds of ETF choices, be sure to reference Thursday’s StatSheet.
For this current domestic “Buy” cycle, here’s how some our candidates have fared:
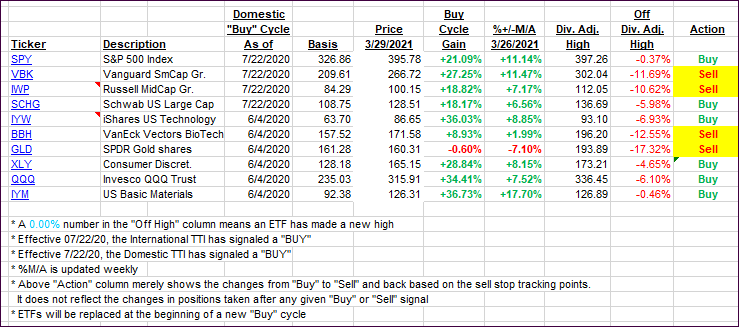
Click image to enlarge.
Again, the %+/-M/A column above shows the position of the various ETFs in relation to their respective long-term trend lines, while the trailing sell stops are being tracked in the “Off High” column. The “Action” column will signal a “Sell” once the -8% point has been taken out in the “Off High” column. For more volatile sector ETFs, the trigger point is -10%.
3. Trend Tracking Indexes (TTIs)
Our TTIs slipped only a tad when the major indexes crawled out of an early hole.
This is how we closed 3/29/2021:
Domestic TTI: +18.50% above its M/A (prior close +19.12%)—Buy signal effective 07/22/2020.
International TTI: +16.20% above its M/A (prior close +16.34%)—Buy signals effective 07/22/2020.
Disclosure: I am obliged to inform you that I, as well as my advisory clients, own some of the ETFs listed in the above table. Furthermore, they do not represent a specific investment recommendation for you, they merely show which ETFs from the universe I track are falling within the specified guidelines.
Contact Ulli