
- Moving the markets
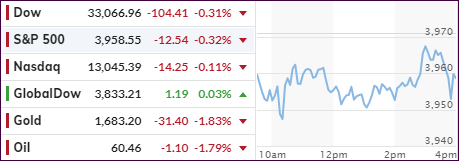
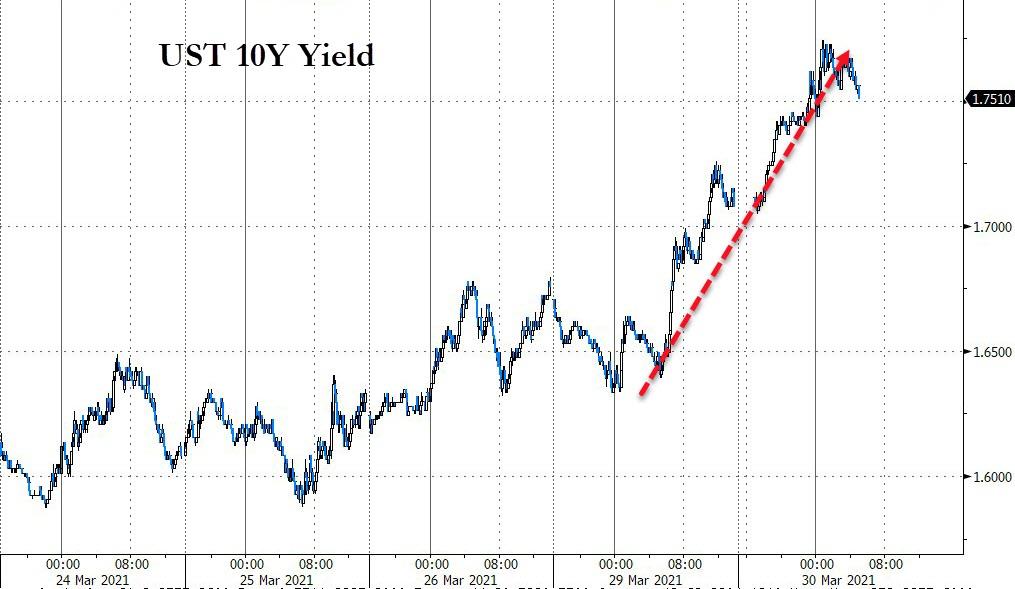
An early rise in bond yields, with the 10-year touching its highest level since January 2020, sent the major indexes on a southerly path and into another hole. That seemed to have been the theme as of late, with equities scrambling to get back to their respective unchanged lines.
Today was no different, and the roller coaster ride continued unabated, but all attempts to reach green numbers failed, however, the losses were moderate.
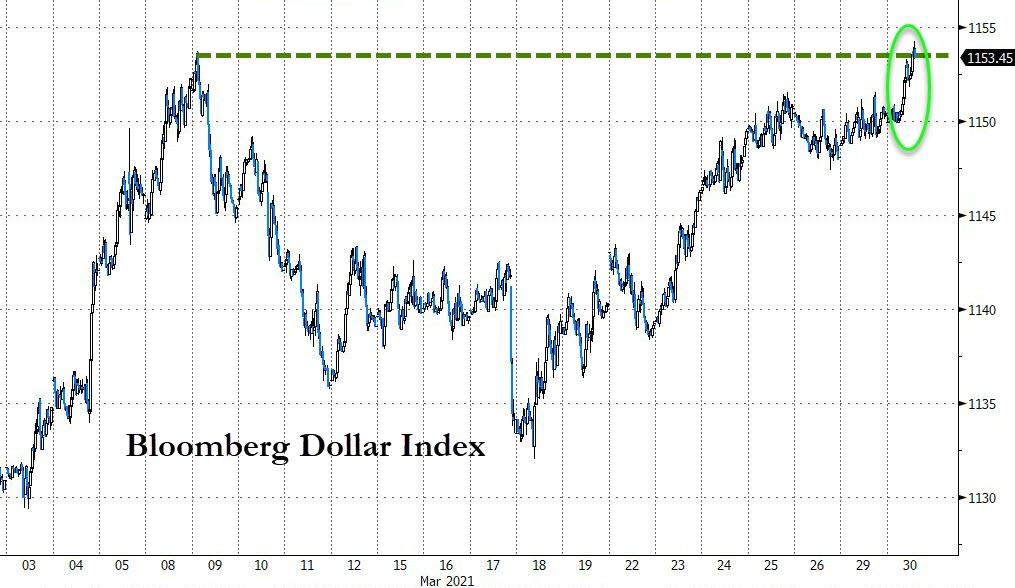
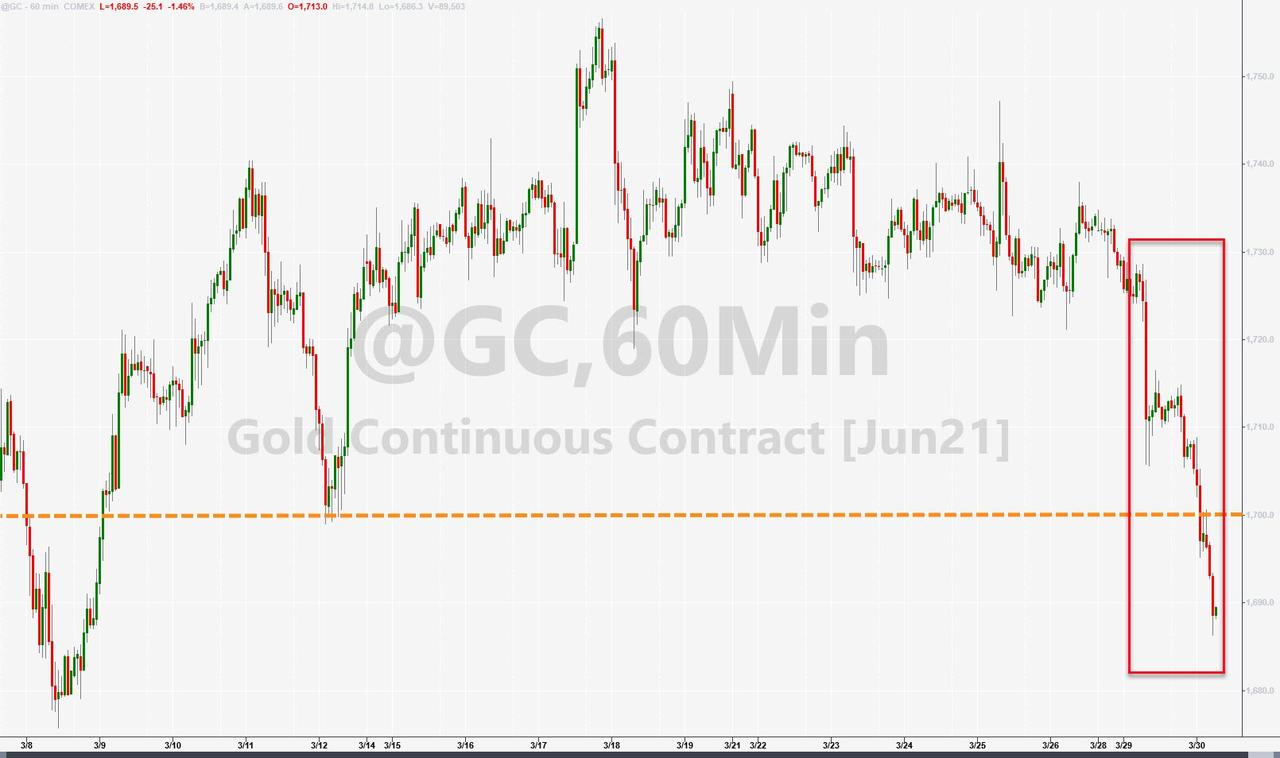
These rising bond yields were accompanied by a surging US Dollar, both of which combined forces to pummel gold back below the $1,700 level. It seems that despite inflationary concerns, because of the reckless money printing scheme, along with fears of stagflation, should support the precious metal, but so far that has not happened.
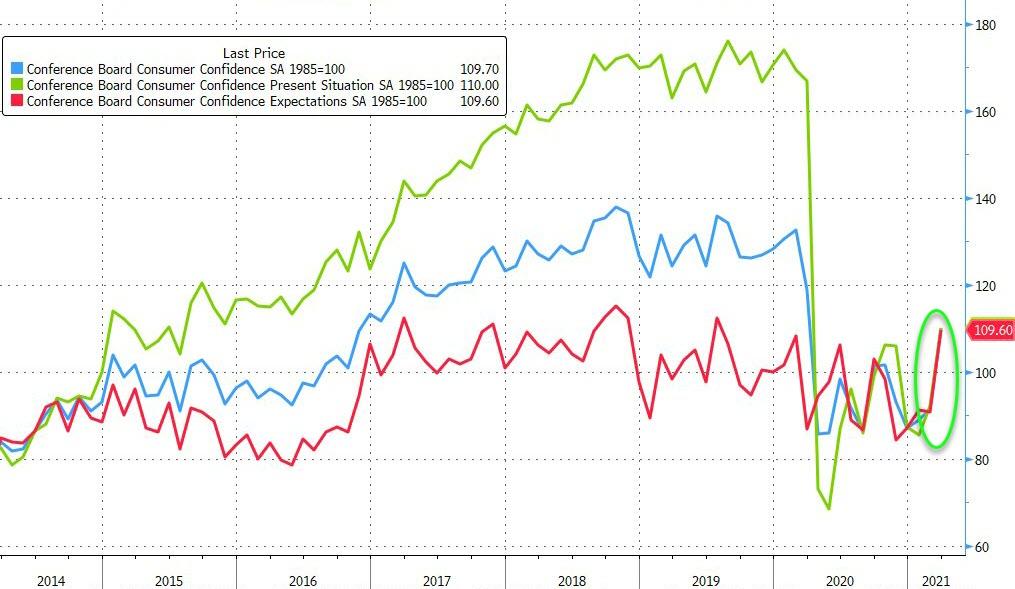
Right now, we seem to be engaged in a tug-of-war, where on one side higher rates are being interpreted as fears of inflation while on the side optimism about the economy reigns supreme. The latter was supported today by a positive reading of Consumer Confidence, which exceeded expectations.
Opinions about market direction are plentiful and some oppose each other.
Here’s Fed Reserve Bank of Dallas President Robert Kaplan:
“I’m concerned about excess risk-taking and if that excess risk-taking goes too far, whether it creates excesses and imbalances, that could ultimately create challenges. Equity market cap, divided by gross domestic product, that’s at a historically elevated level. Credit spreads, in the corporate bond markets, are at, relatively speaking, historically tight levels. There’s no question that financial assets, broadly, are at elevated valuation levels.”
Analysts at Evercore saw it differently:
“The significant tailwinds propelling equities higher and the forces that have driven equities into, during, and now out of the pandemic remain. Investors seem to understand that faster growth, rising earnings growth expectations, still historically low corporate borrowing costs, and pent-up consumer demand will fuel further market gains.”
That leaves it wide open as to where the markets will travel next. In my advisor practice, we continue to follow the major trends and let our trailing sell stops be our guide as to when to exit a questionable position.
2. ETFs in the Spotlight
In case you missed the announcement and description of this section, you can read it here again.
It features some of the 10 broadly diversified domestic and sector ETFs from my HighVolume list as posted every Saturday. Furthermore, they are screened for the lowest MaxDD% number meaning they have been showing better resistance to temporary sell offs than all others over the past year.
The below table simply demonstrates the magnitude with which these ETFs are fluctuating above or below their respective individual trend lines (%+/-M/A). A break below, represented by a negative number, shows weakness, while a break above, represented by a positive percentage, shows strength.
For hundreds of ETF choices, be sure to reference Thursday’s StatSheet.
For this current domestic “Buy” cycle, here’s how some our candidates have fared:
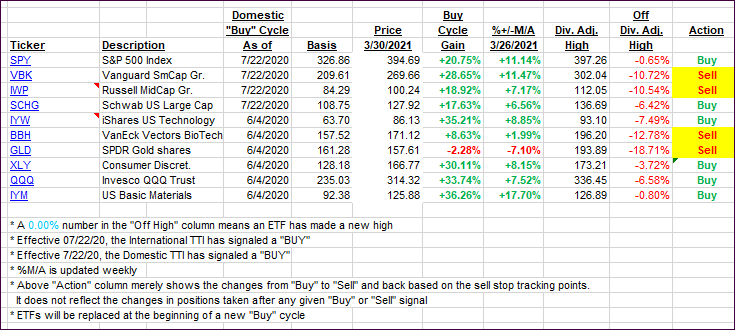
Click image to enlarge.
Again, the %+/-M/A column above shows the position of the various ETFs in relation to their respective long-term trend lines, while the trailing sell stops are being tracked in the “Off High” column. The “Action” column will signal a “Sell” once the -8% point has been taken out in the “Off High” column. For more volatile sector ETFs, the trigger point is -10%.
3. Trend Tracking Indexes (TTIs)
Our TTIs barely changed as a result of aimless meandering in the markets.
This is how we closed 3/30/2021:
Domestic TTI: +18.73% above its M/A (prior close +18.50%)—Buy signal effective 07/22/2020.
International TTI: +16.38% above its M/A (prior close +16.20%)—Buy signals effective 07/22/2020.
Disclosure: I am obliged to inform you that I, as well as my advisory clients, own some of the ETFs listed in the above table. Furthermore, they do not represent a specific investment recommendation for you, they merely show which ETFs from the universe I track are falling within the specified guidelines.
Contact Ulli