
- Moving the markets
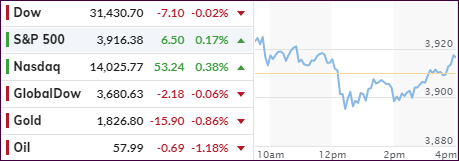
This session turned out to be very similar to the last two, with the major indexes looking for direction but ending up getting stuck in a sideways pattern with not much won and not much lost.
The S&P 500 and Nasdaq eked out some small gains while the Dow slipped a tad into the red. Even this year’s powerhouse, SmallCaps (IWO), could not muster any strength, but closed in the green by a meager +0.08% and were outperformed by MidCaps (IWP), which sported a +0.72% gain.
It appears that the strong February rally has hit a flat spot and is need of a new driver to pick up the recently lost momentum. Fiscal and monetary stimulus have been priced in the markets, with all eyes now being on a broader economic recovery, along with a broader reopening of businesses and an improved distribution of the vaccine.
Not helping matters today was a worse-than-expected reading of weekly jobless claims. First time filers totaled 793k, which was higher than the expected 760k. Those week numbers go along with Fed head Powell’s assessment yesterday that “in real terms, unemployment remains around 10%, as bad as at the peak of the financial crises.”
He then added:
“Published unemployment rates during COVID have dramatically understated the deterioration in the labor market.”
Also increasing uncertainty was the rise in bond yields during the 30-year auction, which left some traders scratching their head, as yields spiked after their recent easing, demonstrated in this chart by Bloomberg.
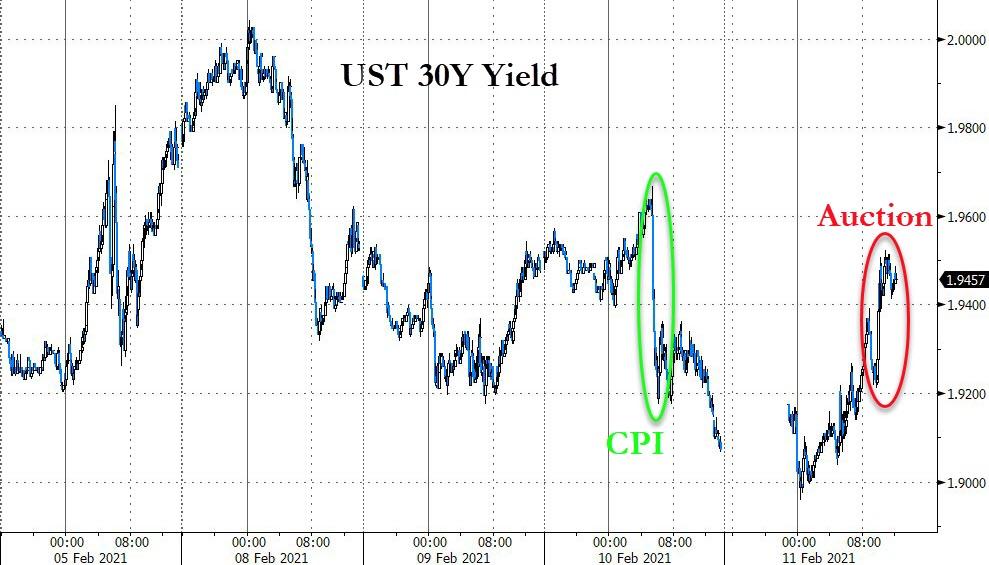
The US Dollar continued on its southerly path, but it was not enough, given spiking bond yields, to support gold, which subsequently surrendered -0.88%.
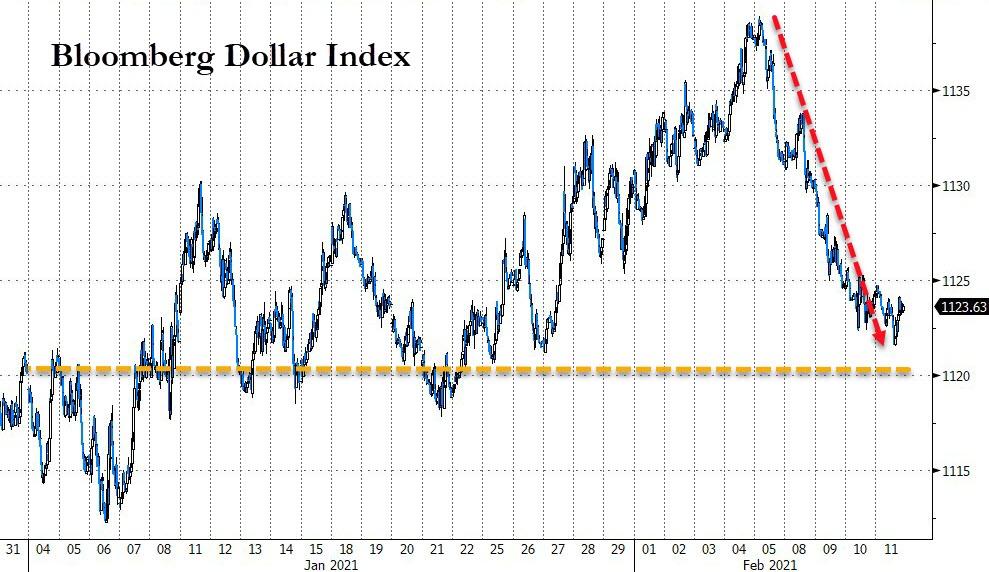
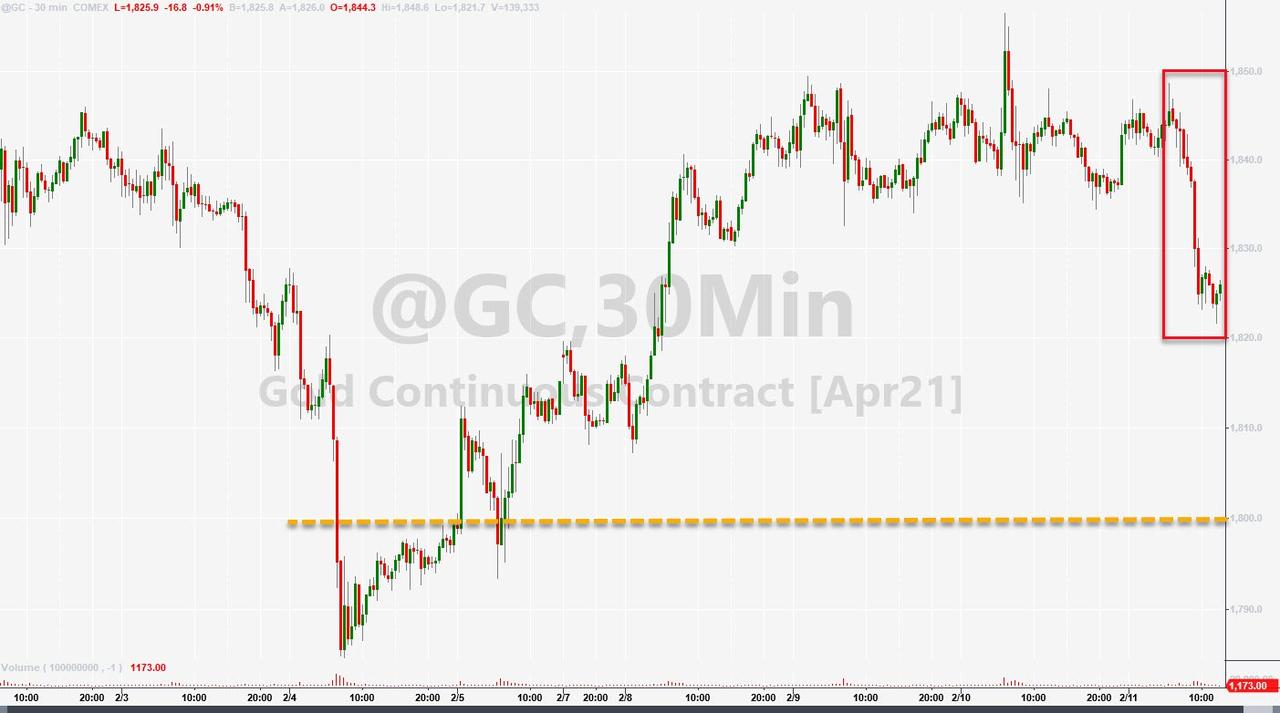
ZH featured another analog comparison to the 1929-1932 period asking this question:
“It’s different this time…but will it end the same?”
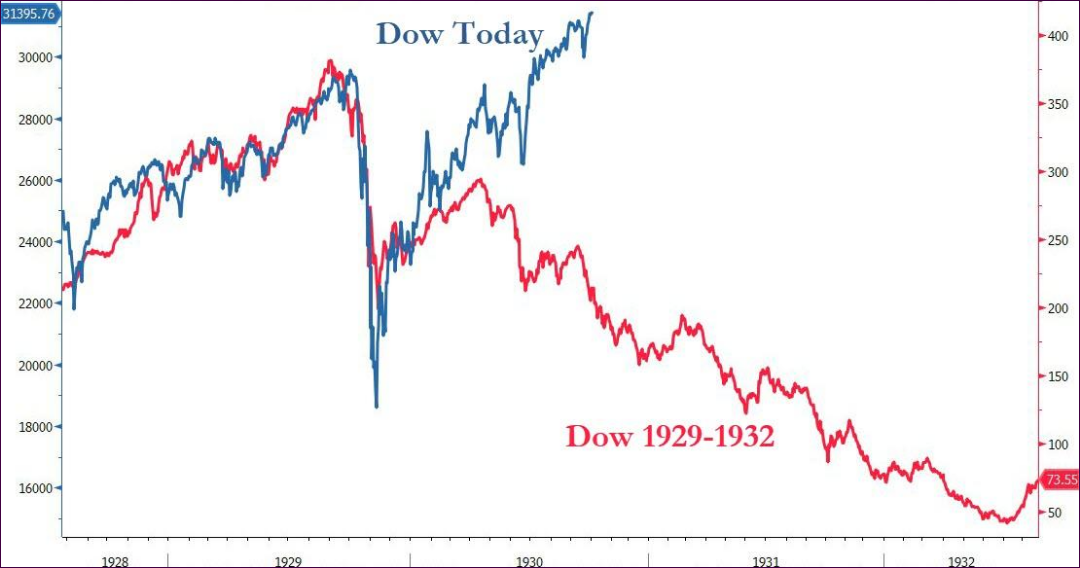
Just food for thought.
2. ETFs in the Spotlight
In case you missed the announcement and description of this section, you can read it here again.
It features some of the 10 broadly diversified domestic and sector ETFs from my HighVolume list as posted every Saturday. Furthermore, they are screened for the lowest MaxDD% number meaning they have been showing better resistance to temporary sell offs than all others over the past year.
The below table simply demonstrates the magnitude with which these ETFs are fluctuating above or below their respective individual trend lines (%+/-M/A). A break below, represented by a negative number, shows weakness, while a break above, represented by a positive percentage, shows strength.
For hundreds of ETF choices, be sure to reference Thursday’s StatSheet.
For this current domestic “Buy” cycle, here’s how some our candidates have fared:
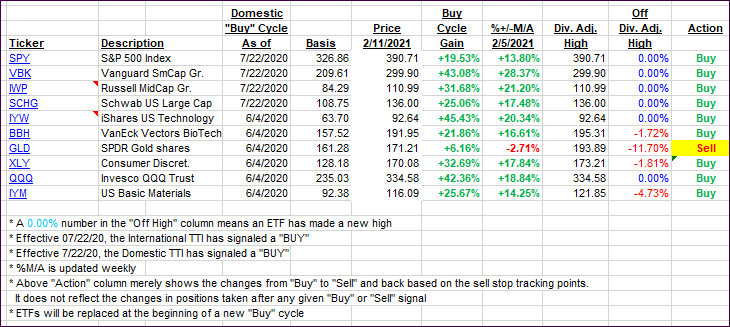
Click image to enlarge.
Again, the %+/-M/A column above shows the position of the various ETFs in relation to their respective long-term trend lines, while the trailing sell stops are being tracked in the “Off High” column. The “Action” column will signal a “Sell” once the -8% point has been taken out in the “Off High” column. For more volatile sector ETFs, the trigger point is -10%.
3. Trend Tracking Indexes (TTIs)
Our TTIs remained just about unchanged.
This is how we closed 2/11/2021:
Domestic TTI: +19.13% above its M/A (prior close +19.10%)—Buy signal effective 07/22/2020.
International TTI: +18.20% above its M/A (prior close +18.24%)—Buy signal effective 07/22/2020.
Disclosure: I am obliged to inform you that I, as well as my advisory clients, own some of the ETFs listed in the above table. Furthermore, they do not represent a specific investment recommendation for you, they merely show which ETFs from the universe I track are falling within the specified guidelines.
Contact Ulli