
- Moving the markets
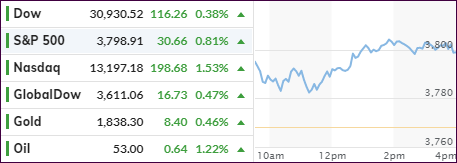
The futures markets continued their rebound from yesterday into the regular session and recouped all of Friday’s losses. Propped up by Biden’s $1.9 trillion fiscal stimulus package, traders and algos alike shoved the markets higher with the major indexes never threatening to dip into the red.
Helping the bullish mood was willingness by the Fed to support markets, as well as news of a “stepping up” of the vaccine rollout. An additional assist came from Janet Yellen, the designated nominee for Treasury Secretary, who urged to “act big:”
“Neither the president-elect, nor I, propose this relief package without an appreciation for the country’s debt burden. But right now, with interest rates at historic lows, the smartest thing we can do is act big,” said Yellen. “I believe the benefits will far outweigh the costs, especially if we care about helping people who have been struggling for a very long time.”
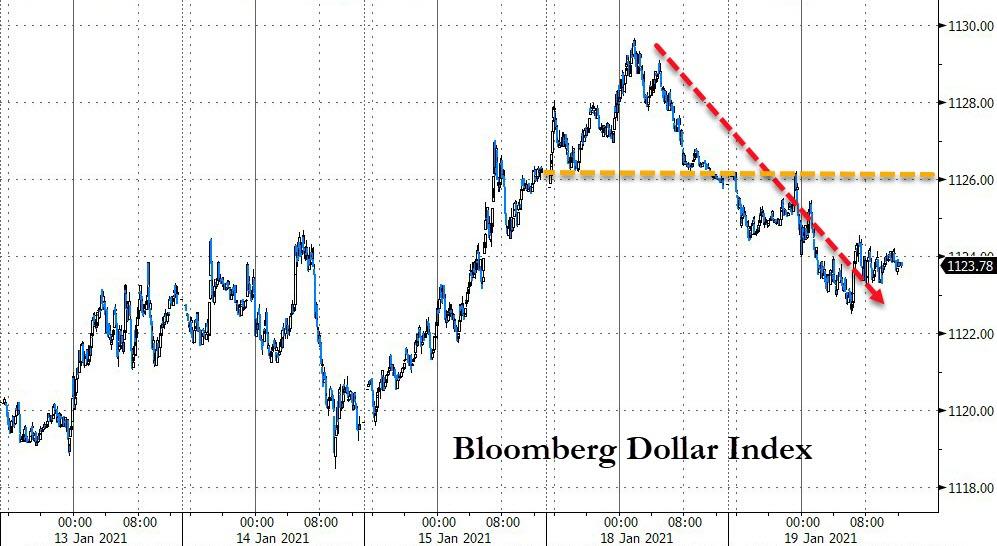
Hmm… going “big” is just not a term that I like to hear, since it implies the sort of recklessness in terms of debt/deficits that only a politician can come up with. But it was exactly what Wall Street wanted to hear and as a result equities, bonds and precious metals gained, while the US Dollar dropped.
Though the Nasdaq led by adding +1.53%, it was bested again by SmallCaps (IWO), which surged an impressive +1.95%. Even GLD held ground for a change and gained +0.82%.
If tomorrow’s inauguration goes as anticipated, we may see a relief rally only due to the last remaining election uncertainty having been removed.
2. ETFs in the Spotlight
In case you missed the announcement and description of this section, you can read it here again.
It features some of the 10 broadly diversified domestic and sector ETFs from my HighVolume list as posted every Saturday. Furthermore, they are screened for the lowest MaxDD% number meaning they have been showing better resistance to temporary sell offs than all others over the past year.
The below table simply demonstrates the magnitude with which these ETFs are fluctuating above or below their respective individual trend lines (%+/-M/A). A break below, represented by a negative number, shows weakness, while a break above, represented by a positive percentage, shows strength.
For hundreds of ETF choices, be sure to reference Thursday’s StatSheet.
For this current domestic “Buy” cycle, here’s how some our candidates have fared:
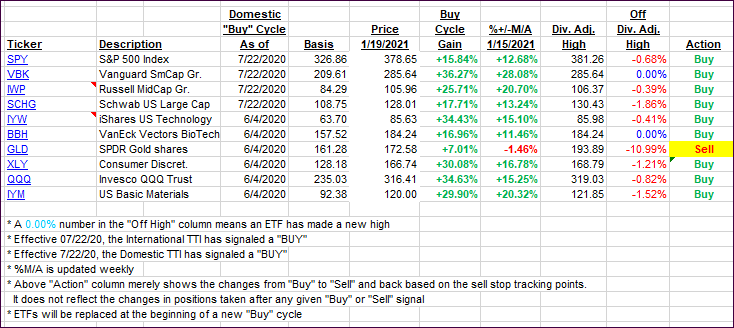
Click image to enlarge.
Again, the %+/-M/A column above shows the position of the various ETFs in relation to their respective long-term trend lines, while the trailing sell stops are being tracked in the “Off High” column. The “Action” column will signal a “Sell” once the -8% point has been taken out in the “Off High” column. For more volatile sector ETFs, the trigger point is -10%.
3. Trend Tracking Indexes (TTIs)
Our TTIs edged higher by a tiny amount.
This is how we closed 1/19/2021:
Domestic TTI: +19.87% above its M/A (prior close +19.30%)—Buy signal effective 07/22/2020.
International TTI: +18.79% above its M/A (prior close +18.39%)—Buy signal effective 07/22/2020.
Disclosure: I am obliged to inform you that I, as well as my advisory clients, own some of the ETFs listed in the above table. Furthermore, they do not represent a specific investment recommendation for you, they merely show which ETFs from the universe I track are falling within the specified guidelines.
Contact Ulli