
- Moving the markets
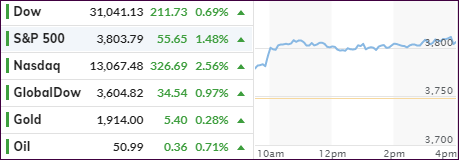
The mood today was up, up, and away with hardly any intra-day corrections. An early jump set the major indexes on track for smooth sailing throughout the session with all of them ending in record territory.
Traders decided that after the roller coaster ride of the past few days, and the political tug-of-war nearing an end, expectations of a massive stimulus program would be a virtual certainty with most of that money finding its way into the markets.
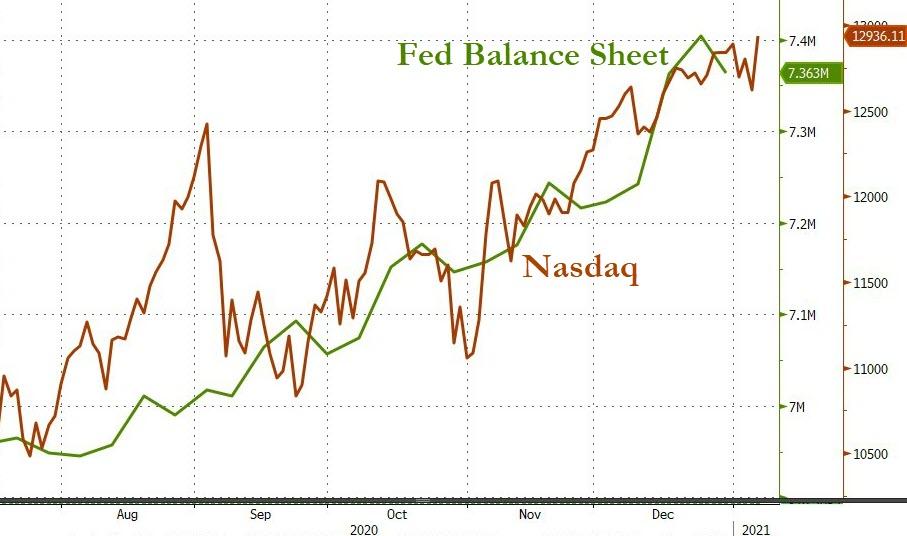
After some soggy recent performance, the Nasdaq took center stage with not only a +2.56% gain but also closing above 13,000 for the first time. Despite that breathtaking advance, MidCaps led the way with +2.81% barely ahead of SmallCaps with +2.61%.
It seems like the worse things get, the more the stock market likes it, which was the title of an article by author Michal Synder, who summed things up like this:
Of course, the bigger news on Wednesday was the utter chaos that we witnessed at the U.S. Capitol in Washington. Doors and windows were smashed, members of Congress had to be evacuated, and protesters freely roamed through the halls and offices. You would think that something like that would definitely send stock prices plunging, but instead the Dow ended the day up 437 points.
Even though we have just come through the worst year in recent memory, and even though our system of government is in disarray, stock prices hit an all-time record high on Wednesday.
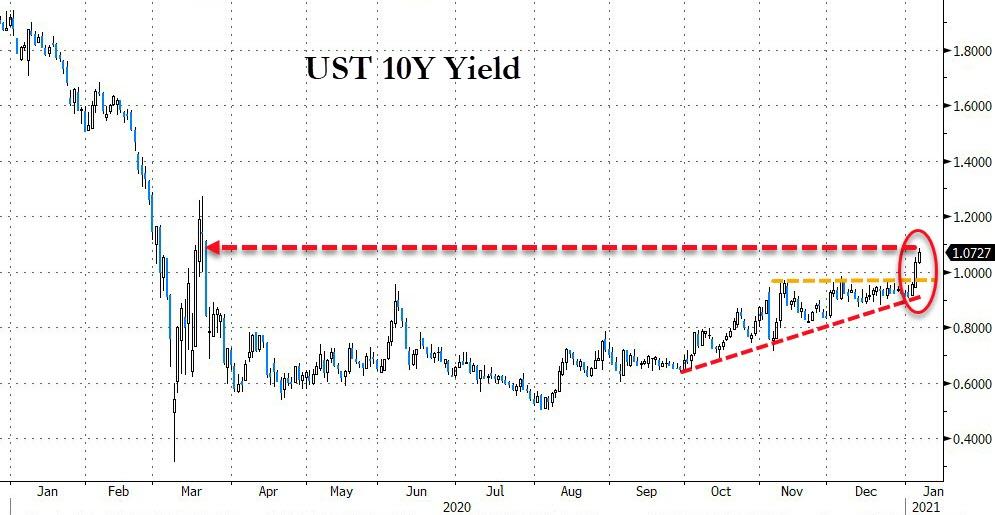
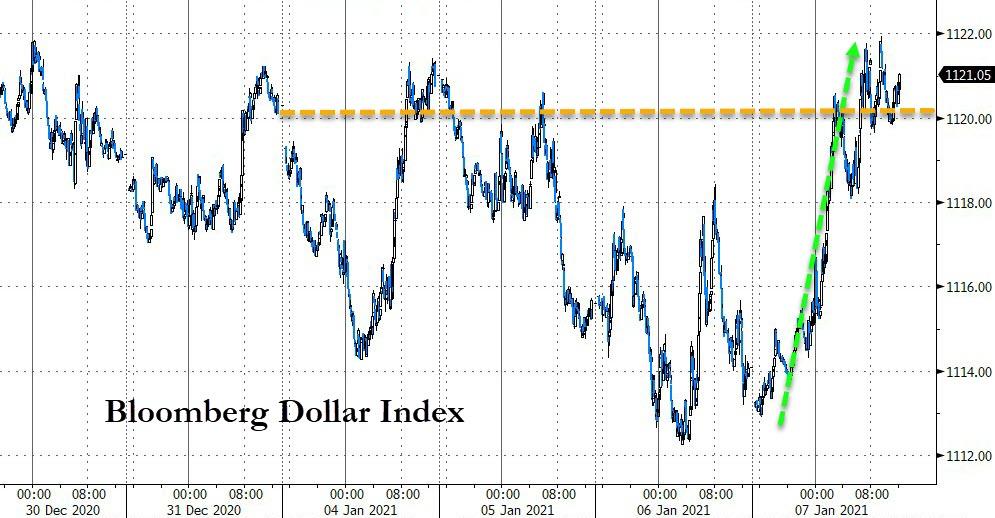
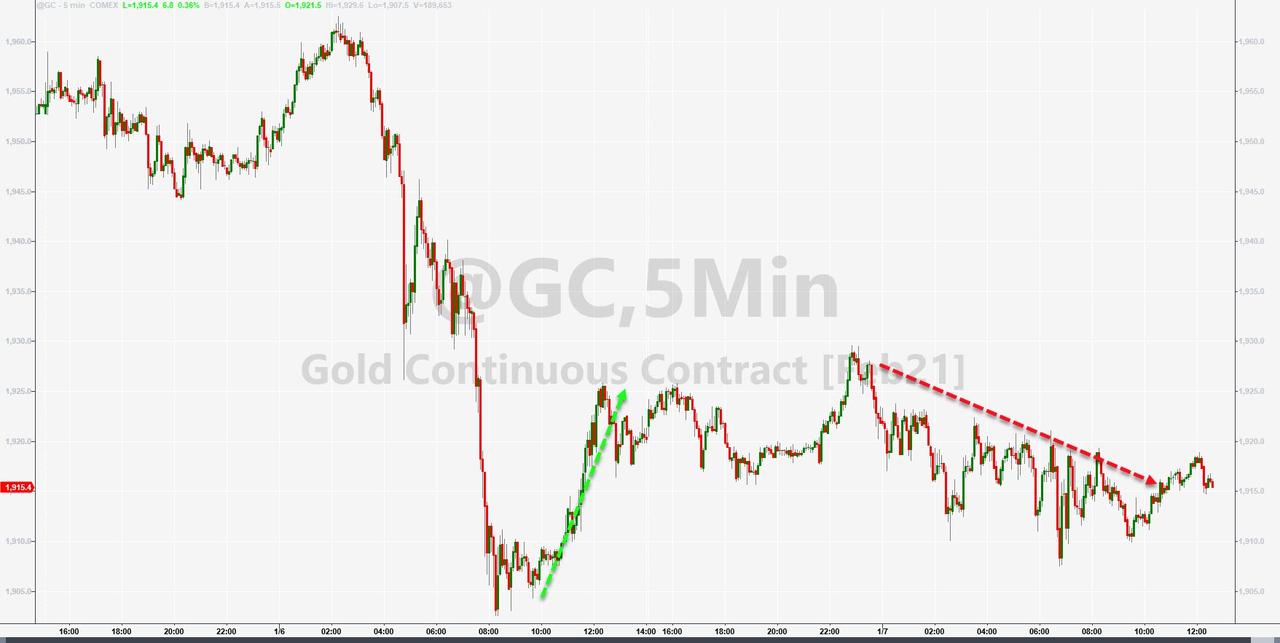
10-year bond yields continued higher and are closing in on their highest spike since March last year, nearing 1.09% intraday, as ZH pointed out. The US Dollar found some life and surged thereby taking any starch out of Gold’s attempt to build on yesterday’s rebound.
In the end, further advances will be supported by a continued expansion of the Fed’s balance sheet, as Bloomberg points out in this chart. However, the fly in the ointment could be surging bond yields which, if left unchecked, will be the great equalizer.
2. ETFs in the Spotlight
In case you missed the announcement and description of this section, you can read it here again.
It features some of the 10 broadly diversified domestic and sector ETFs from my HighVolume list as posted every Saturday. Furthermore, they are screened for the lowest MaxDD% number meaning they have been showing better resistance to temporary sell offs than all others over the past year.
The below table simply demonstrates the magnitude with which these ETFs are fluctuating above or below their respective individual trend lines (%+/-M/A). A break below, represented by a negative number, shows weakness, while a break above, represented by a positive percentage, shows strength.
For hundreds of ETF choices, be sure to reference Thursday’s StatSheet.
For this current domestic “Buy” cycle, here’s how some our candidates have fared:
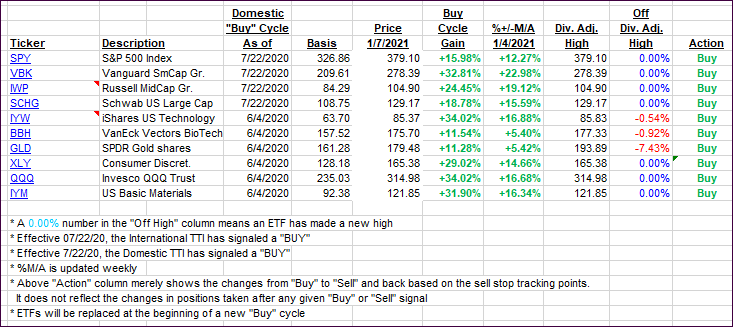
Click image to enlarge.
Again, the %+/-M/A column above shows the position of the various ETFs in relation to their respective long-term trend lines, while the trailing sell stops are being tracked in the “Off High” column. The “Action” column will signal a “Sell” once the -8% point has been taken out in the “Off High” column. For more volatile sector ETFs, the trigger point is -10%.
3. Trend Tracking Indexes (TTIs)
Our TTIs marched higher as the bullish meme remains in full force.
This is how we closed 1/07/2021:
Domestic TTI: +21.46% above its M/A (prior close +20.26%)—Buy signal effective 07/22/2020.
International TTI: +20.65% above its M/A (prior close +19.68%)—Buy signal effective 07/22/2020.
Disclosure: I am obliged to inform you that I, as well as my advisory clients, own some of the ETFs listed in the above table. Furthermore, they do not represent a specific investment recommendation for you, they merely show which ETFs from the universe I track are falling within the specified guidelines.
Contact Ulli