
- Moving the markets
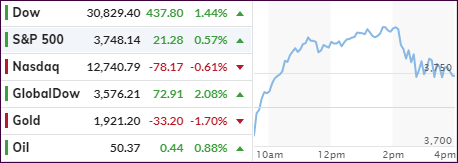
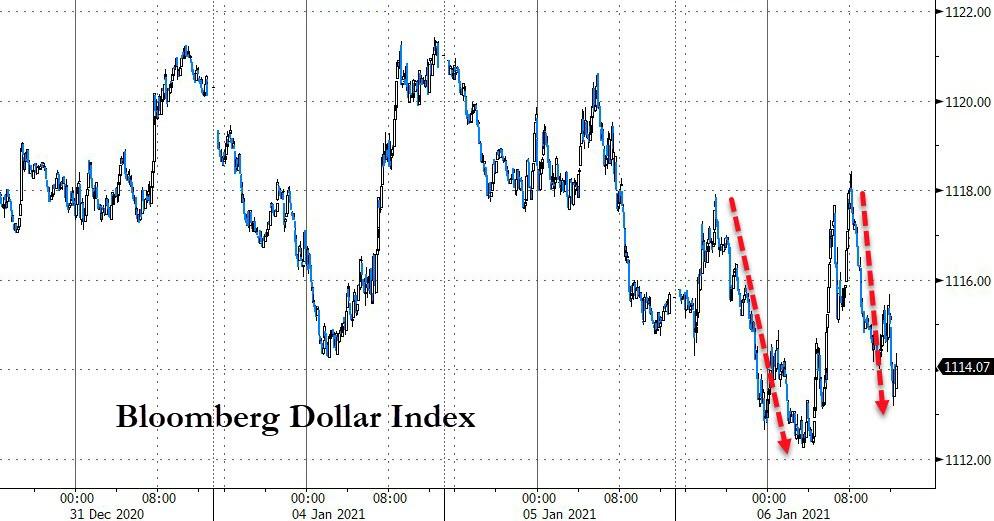
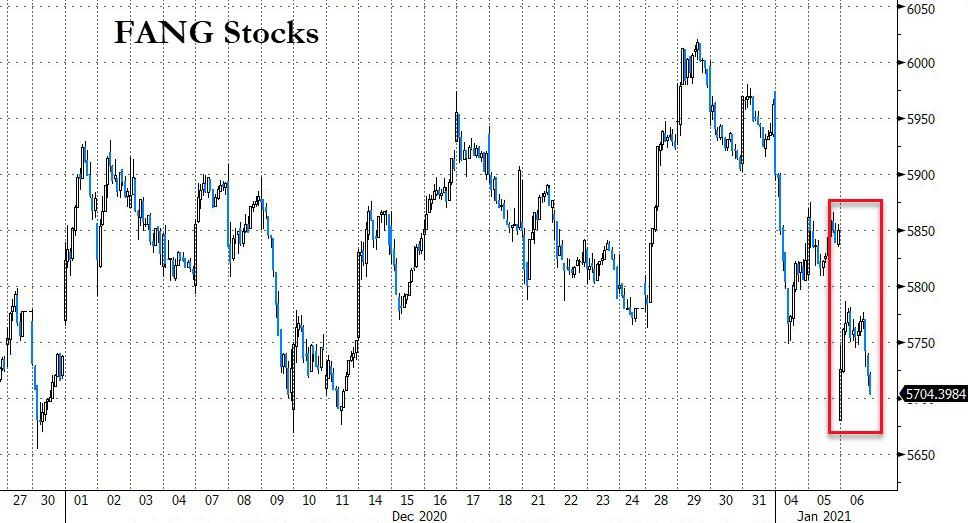
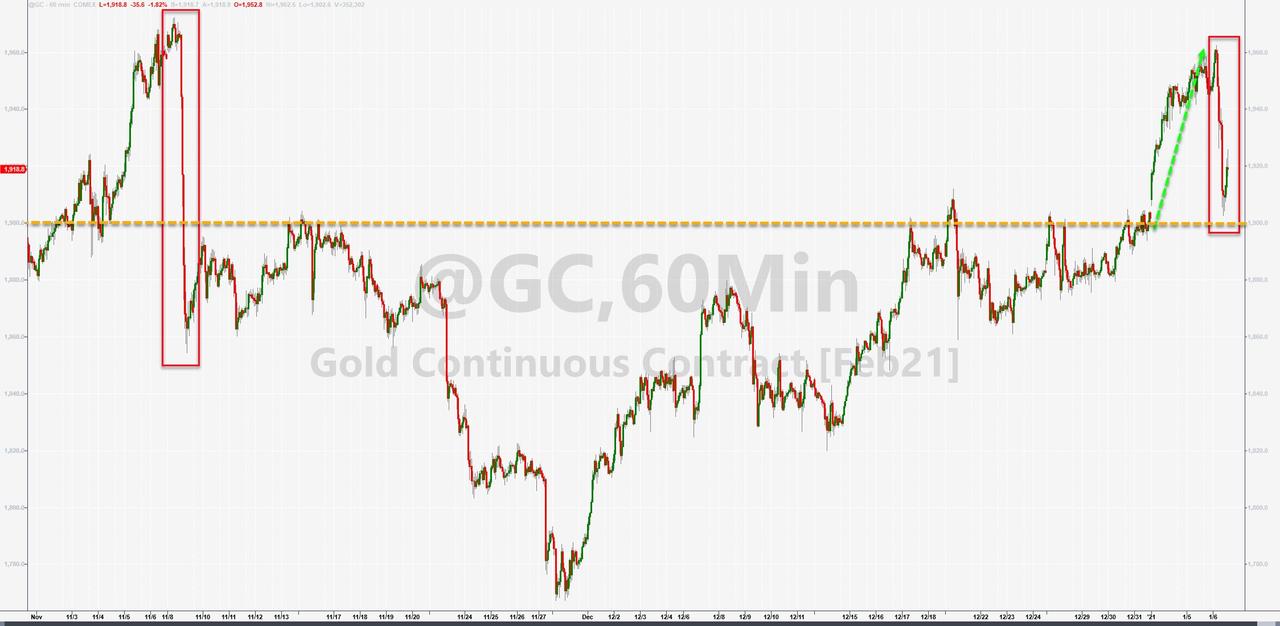
Following the Georgia run-off elections, which are favoring the Democrats, the markets were in a split mode with bond yields and SmallCaps surging, even though the US Dollar and the tech sector were stumbling. Gold did its best imitation of a swan dive and gave up its YTD gains.
It’s widely assumed that, should the Dems take the Senate, tougher tech regulations will be on deck, hurting that sector, with more stimulus in the pipeline affecting the dollar adversely.
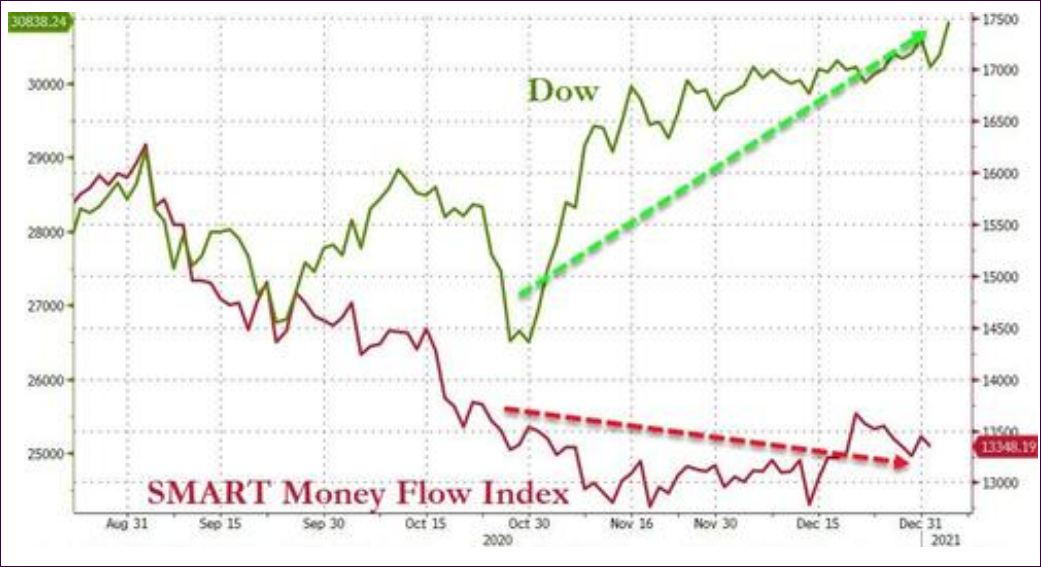
Despite the late sell-off, in part caused by protesters storming the Capitol, the Dow held up the best and closed in record territory. Still, the Dow’s +1.44% gain was bested again by SmallCaps, which added +2.88%.
CNBC saw it this way:
Tech stocks — the best-performing market group over the past year — lagged on Wednesday amid concerns over higher tax rates. The prospects of new stimulus also made tech stocks less attractive relative to beaten-down cyclical names.
It’s amazing that the equities overall performed as well as they did with bond yield spiking and the 10-year shooting through the 1% glass ceiling without a problem. For sure, if that trend continues for any length of time, it will affect stocks negatively.
This makes me wonder, if the “Smart Money” indeed is looking a little bit further ahead, which may be why Bloomberg’s chart below has not changed at all:
2. ETFs in the Spotlight
In case you missed the announcement and description of this section, you can read it here again.
It features some of the 10 broadly diversified domestic and sector ETFs from my HighVolume list as posted every Saturday. Furthermore, they are screened for the lowest MaxDD% number meaning they have been showing better resistance to temporary sell offs than all others over the past year.
The below table simply demonstrates the magnitude with which these ETFs are fluctuating above or below their respective individual trend lines (%+/-M/A). A break below, represented by a negative number, shows weakness, while a break above, represented by a positive percentage, shows strength.
For hundreds of ETF choices, be sure to reference Thursday’s StatSheet.
For this current domestic “Buy” cycle, here’s how some our candidates have fared:
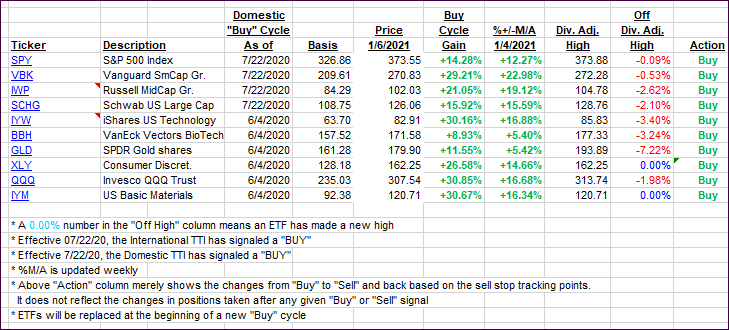
Click image to enlarge
Again, the %+/-M/A column above shows the position of the various ETFs in relation to their respective long-term trend lines, while the trailing sell stops are being tracked in the “Off High” column. The “Action” column will signal a “Sell” once the -8% point has been taken out in the “Off High” column. For more volatile sector ETFs, the trigger point is -10%.
3. Trend Tracking Indexes (TTIs)
Our TTIs jumped despite the tech sector closing in the red.
This is how we closed 1/06/2021:
Domestic TTI: +20.26% above its M/A (prior close +17.46%)—Buy signal effective 07/22/2020
International TTI: +19.68% above its M/A (prior close +17.32%)—Buy signal effective 07/22/2020
Disclosure: I am obliged to inform you that I, as well as my advisory clients, own some of the ETFs listed in the above table. Furthermore, they do not represent a specific investment recommendation for you, they merely show which ETFs from the universe I track are falling within the specified guidelines.
Contact Ulli