
- Moving the markets
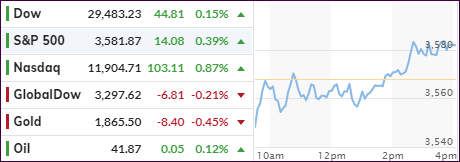
The tech sector, which had been lagging the major indexes for a few weeks, staged a comeback today, as traders suddenly considered it to be some sort of safety play in the face of mounting Covid-19 incidents. As a result, the Nasdaq outperformed the Dow and S&P 500 by a substantial margin.
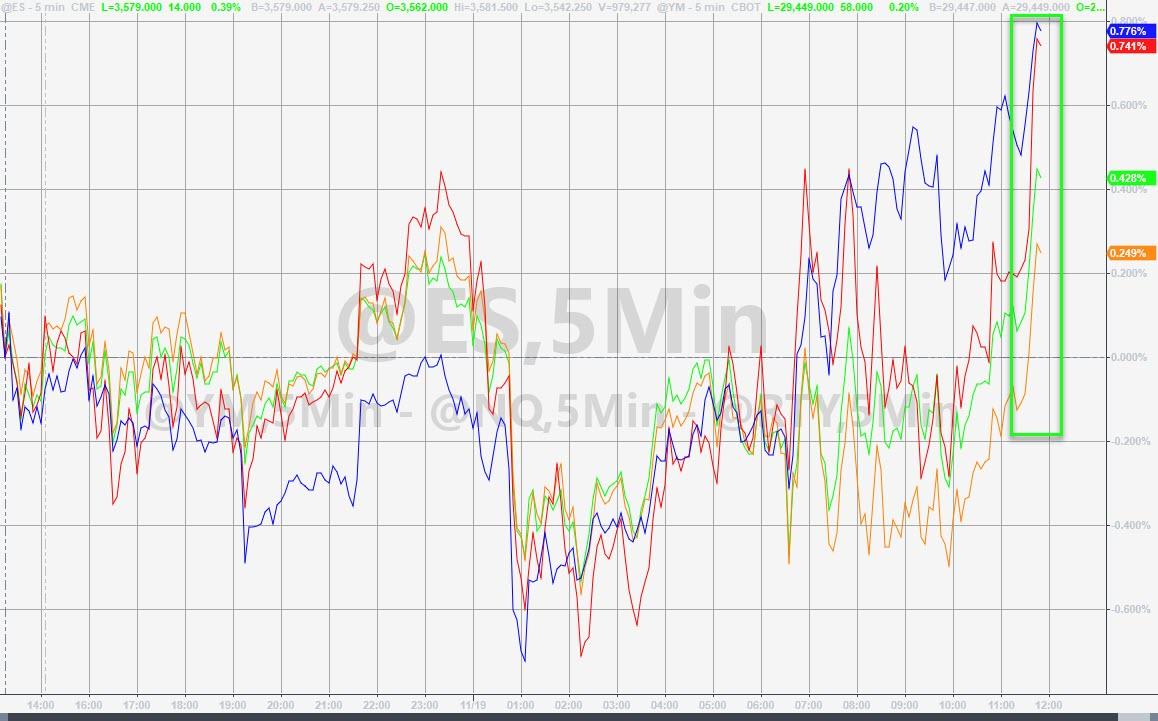
For most of the session, the S&P 500 trod water, but a sudden shift in sentiment caused by a headline pointing to a resumption of negotiations by Democrats and Republicans, was labeled by Politico’s Sherman as follows:
“Republicans are describing the meeting this afternoon as being about government spending ahead of the Dec. 11 deadline while “Democrats are describing the meeting as being about Covid relief/government spending.”
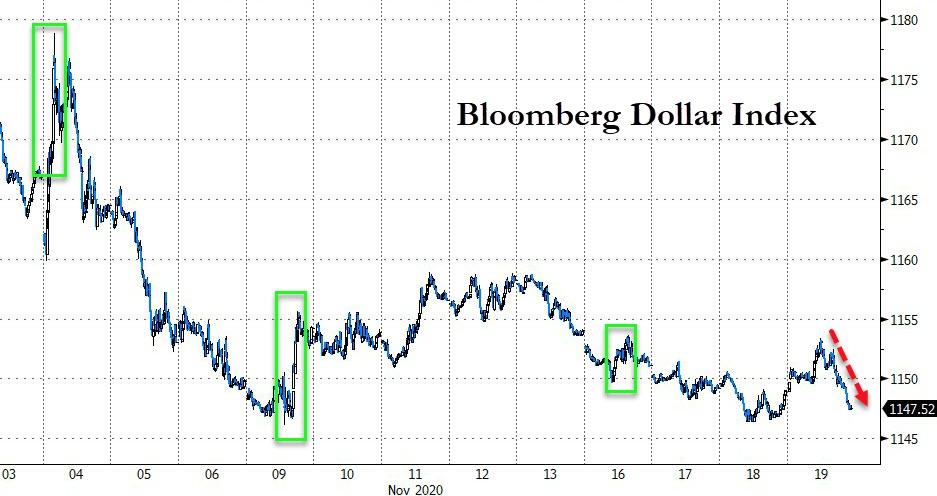
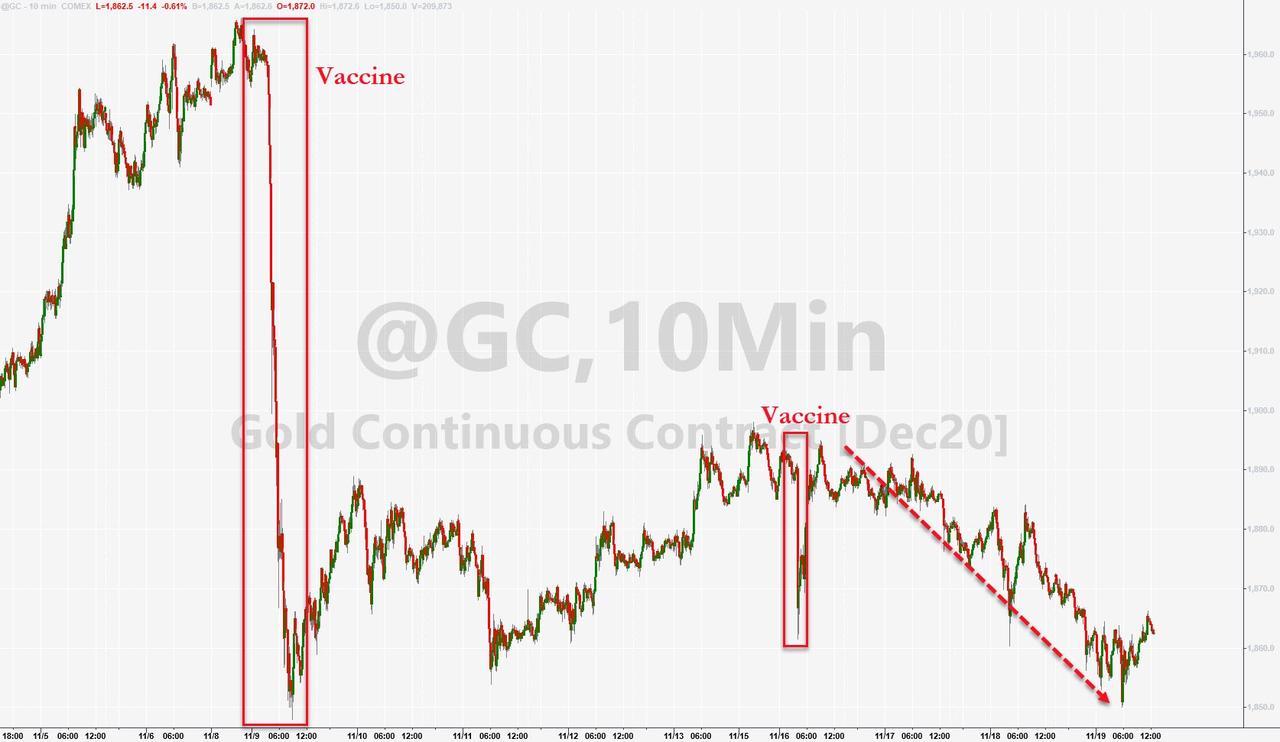
While these are pretty meaningless statements, there apparently was enough meet on the bone to send the algos into overdrive with the indexes suddenly showing signs of life. Though this took the US Dollar down, it was not enough to pump gold back into the green.
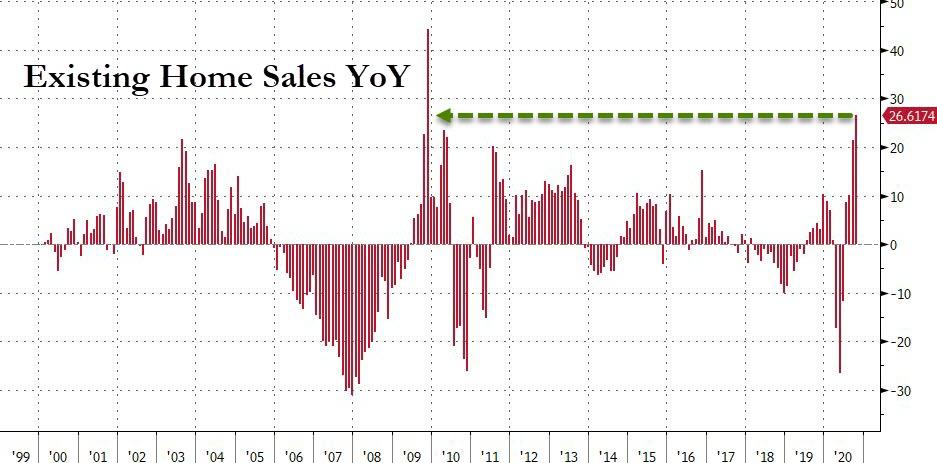
Economic data were mixed with Existing Home Sales soaring to its highest in 15 years, but a re-acceleration of Initial Jobless Claims showing that “only” 742,000 Americans filed for first time unemployment claims last week, offset that news. This broke a 4-week streak of drops, according to ZH, causing fears of more fallout from the second-wave lockdown to become evident.
John Hussman talked about the valuations in US Stocks, which has never been more extreme, even at the 1929 and 2000 market peaks:
He continues to expect the S&P 500 Index to lose two-thirds of its value over the completion of the current market cycle. That loss would not even breach historical valuation norms, but it would at least bring estimates of long-term expected S&P 500 returns closer to their historical average…
As I pointed out yesterday, never become complacent.
2. ETFs in the Spotlight
In case you missed the announcement and description of this section, you can read it here again.
It features some of the 10 broadly diversified domestic and sector ETFs from my HighVolume list as posted every Saturday. Furthermore, they are screened for the lowest MaxDD% number meaning they have been showing better resistance to temporary sell offs than all others over the past year.
The below table simply demonstrates the magnitude with which these ETFs are fluctuating above or below their respective individual trend lines (%+/-M/A). A break below, represented by a negative number, shows weakness, while a break above, represented by a positive percentage, shows strength.
For hundreds of ETF choices, be sure to reference Thursday’s StatSheet.
For this current domestic “Buy” cycle, here’s how some our candidates have fared:
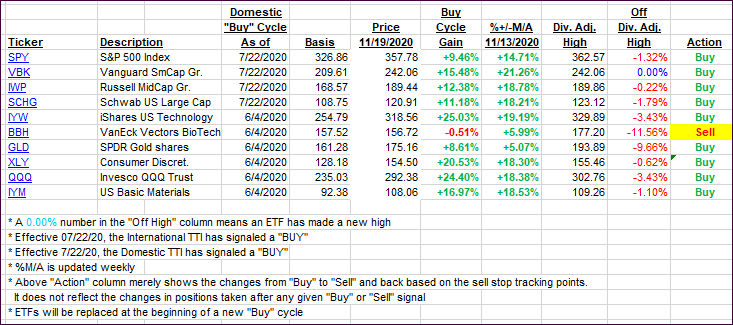
Click image to enlarge
Again, the %+/-M/A column above shows the position of the various ETFs in relation to their respective long-term trend lines, while the trailing sell stops are being tracked in the “Off High” column. The “Action” column will signal a “Sell” once the -8% point has been taken out in the “Off High” column. For more volatile sector ETFs, the trigger point is -10%.
2. Trend Tracking Indexes (TTIs)
Our TTIs diverged with one dropping and the other one adding a tad.
This is how we closed 11/19/2020:
Domestic TTI: +18.76% above its M/A (prior close +18.16%)—Buy signal effective 07/22/2020
International TTI: +15.86% above its M/A (prior close +16.00%)—Buy signal effective 07/22/2020
Disclosure: I am obliged to inform you that I, as well as my advisory clients, own some of the ETFs listed in the above table. Furthermore, they do not represent a specific investment recommendation for you, they merely show which ETFs from the universe I track are falling within the specified guidelines.
Contact Ulli