
- Moving the markets
After the bulls had been manhandled by the bears for the past three session, it was time for a bounce back, and that is what we saw today. Whether it will have legs remains to be seen with the rebound looking tepid for most of the session and sliding into the close.
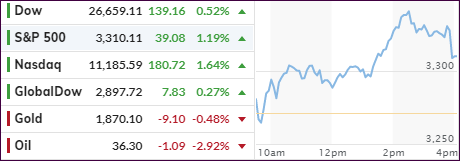
The Nasdaq took the lead ahead of major companies announcing their quarterly results, with CNBC summing up the action like this:
Shares of Amazon and Apple were up by 2.2% and 4.7%, respectively. Alphabet traded 4.1% higher and Facebook popped 5%. All four companies are slated to report earnings after the bell Thursday. Four of the 11 S&P 500 sectors traded more than 2% higher, including tech and communication services. Netflix, meanwhile, surged more than 5% after the company announced it will raise prices for U.S. subscribers.
On the economic front, Pending Home Sales slumped in September by 2.2% MoM, but are showing substantial gains of 21.9% when evaluated on a YoY basis. As was no surprise, GDP soared by a record 33.1% in Q3 after having collapsed the prior quarter by 31.4%, but that does not tell the entire story:
As Bloomberg notes, while the report makes clear that the economy has found a solid footing for now, analysts caution that growth will be much more modest and choppy in months to come, especially as the spread of the virus gathers pace again and lawmakers remain in an extended deadlock over a new stimulus package. Moreover, there are still nearly 11 million fewer workers on payrolls than there were before the pandemic hit, and analysts say a full recovery in GDP is at least several quarters away.
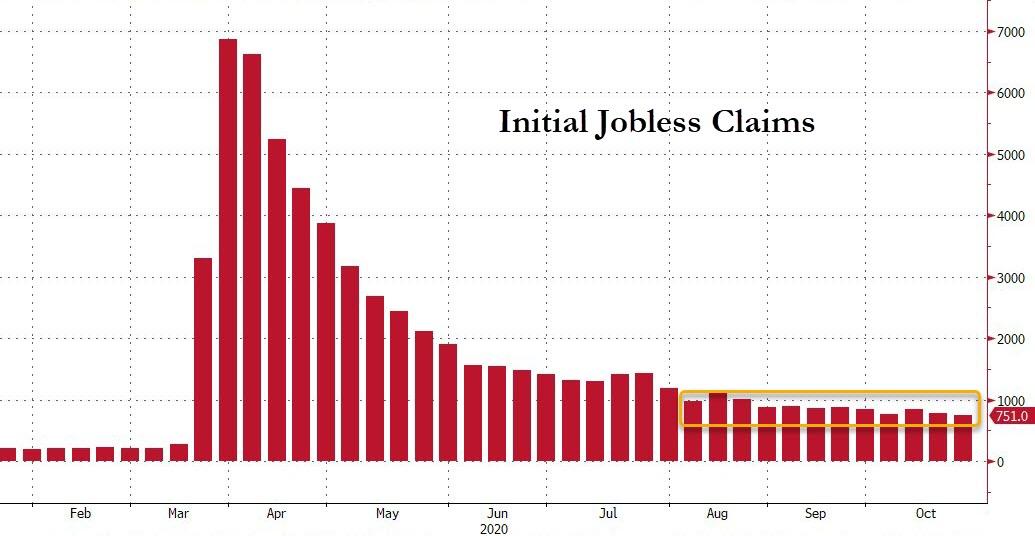
Initial jobless claims, while slightly improved, still paint a horrific picture with ZH adding this often-overlooked fact:
With California’s fraudulent data issues ‘fixed’, initial jobless claims data is at least a little cleaner and printed a better than expected 751k – that’s the best level since pre-lockdown. Reminder, however, that this is still around 4x the pre-lockdown normal.
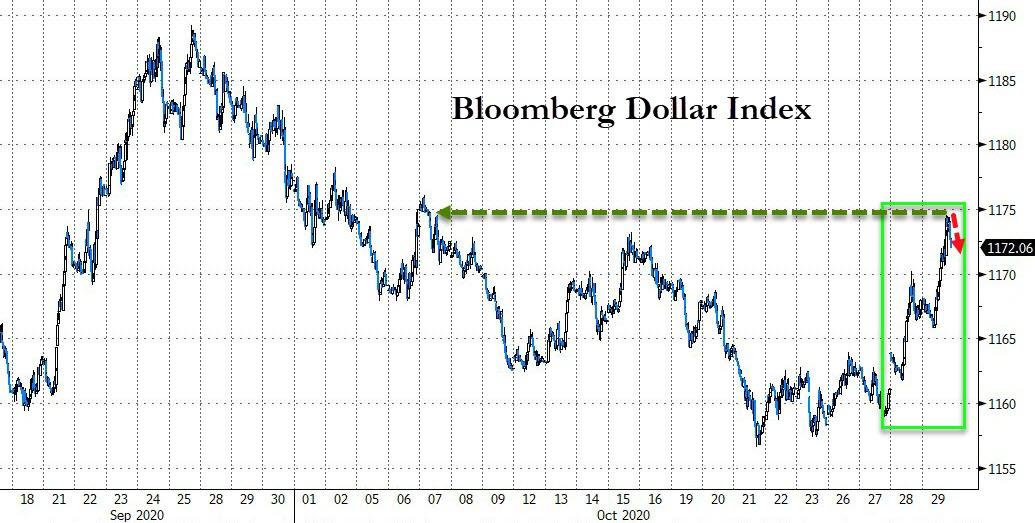
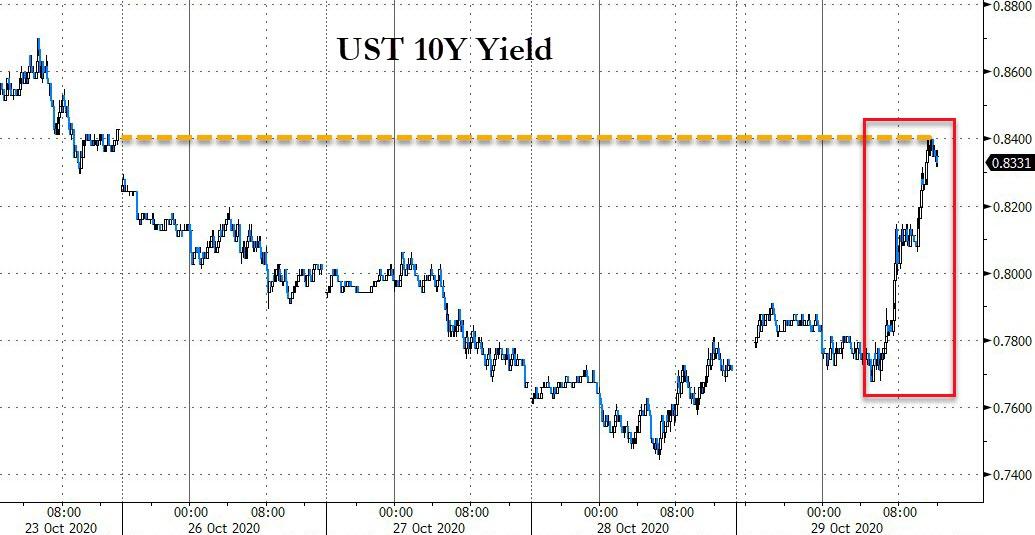
Gold pulled back below the $1,900 level, as the US Dollar continued its march higher, along with bond yields, both of which have hindered any rally attempts by the precious metal.
Tomorrow’s market direction will be primarily influenced by tech earnings unless the tug-of-war over the stimulus package suddenly concludes. Yeah right!
2. ETFs in the Spotlight
In case you missed the announcement and description of this section, you can read it here again.
It features some of the 10 broadly diversified domestic and sector ETFs from my HighVolume list as posted every Saturday. Furthermore, they are screened for the lowest MaxDD% number meaning they have been showing better resistance to temporary sell offs than all others over the past year.
The below table simply demonstrates the magnitude with which these ETFs are fluctuating above or below their respective individual trend lines (%+/-M/A). A break below, represented by a negative number, shows weakness, while a break above, represented by a positive percentage, shows strength.
For hundreds of ETF choices, be sure to reference Thursday’s StatSheet.
For this current domestic “Buy” cycle, here’s how some our candidates have fared:
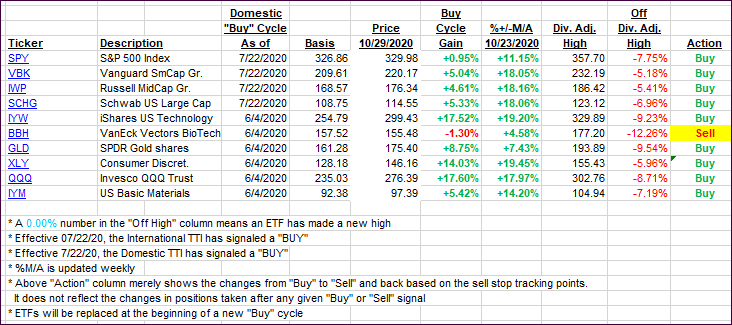
Click image to enlarge
Again, the %+/-M/A column above shows the position of the various ETFs in relation to their respective long-term trend lines, while the trailing sell stops are being tracked in the “Off High” column. The “Action” column will signal a “Sell” once the -8% point has been taken out in the “Off High” column. For more volatile sector ETFs, the trigger point is -10%.
3. Trend Tracking Indexes (TTIs)
Our TTIs recovered as the major indexes finally scored a win for the first time in four sessions.
This is how we closed 10/29/2020:
Domestic TTI: +5.47% above its M/A (prior close +4.41%)—Buy signal effective 07/22/2020
International TTI: +1.39% above its M/A (prior close +1.08%)—Buy signal effective 07/22/2020
Disclosure: I am obliged to inform you that I, as well as my advisory clients, own some of the ETFs listed in the above table. Furthermore, they do not represent a specific investment recommendation for you, they merely show which ETFs from the universe I track are falling within the specified guidelines.
Contact Ulli