
- Moving the markets
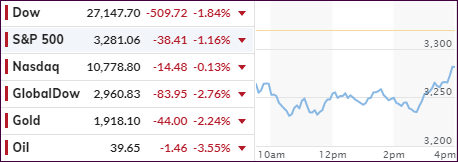
As the futures last night indicated, today would be a downer for the markets, and that’s exactly how it turned out. The Dow was down over 900 points mid-day but recovered to “only” close in the red by some -500 points.
The other two major indexes slumped in similar fashion but recouped better in the end, with especially the Nasdaq almost reaching its unchanged line. Still, one of our holdings clearly pierced its trailing sell stop and was sold.
Of course, the question is: “Is the tech melt over, or has it just started?” No one has the answer, so we have prudently followed our sell stop discipline and took some money of the table, the process of which started almost 3 weeks ago.
The culprits for today’s dump were the same ones as last week, with fears being stoked about the coronavirus’ resurgence across Europe, while at the same time the lack of progress of any stimulus programs rattled the markets. Of course, no doubt, the passing of Bader Ginsburg added a whole new dimension to the word “uncertainty.”
CNBC added some color:
In Washington, negotiations for a new coronavirus stimulus bill could become more complicated after the passing of Supreme Court Justice Ruth Bader Ginsburg, which could lead to a bitter nomination process ahead of the election. President Donald Trump said he would nominate someone this week to take Ginsburg’s seat. Republicans and Democrats have been in a stalemate since July after provisions from the previous stimulus bill expired.
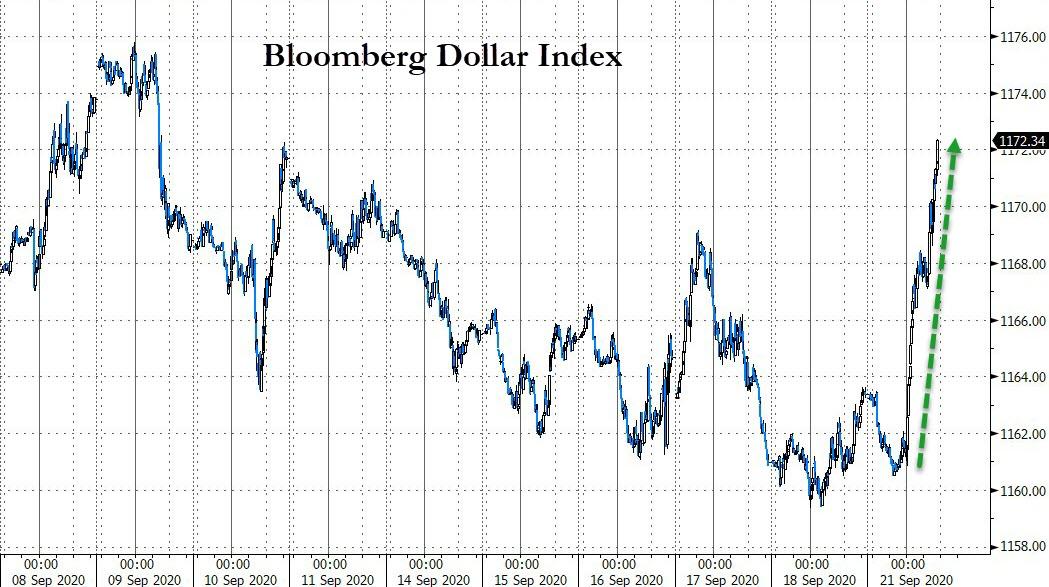
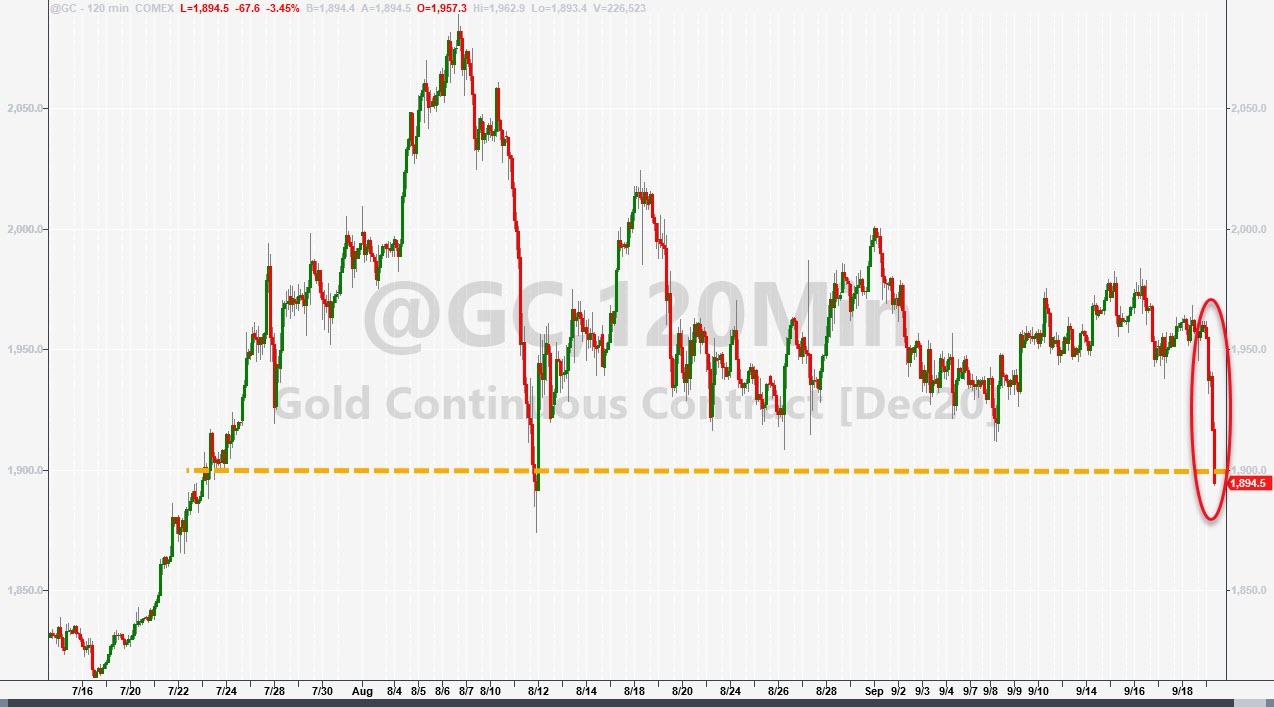
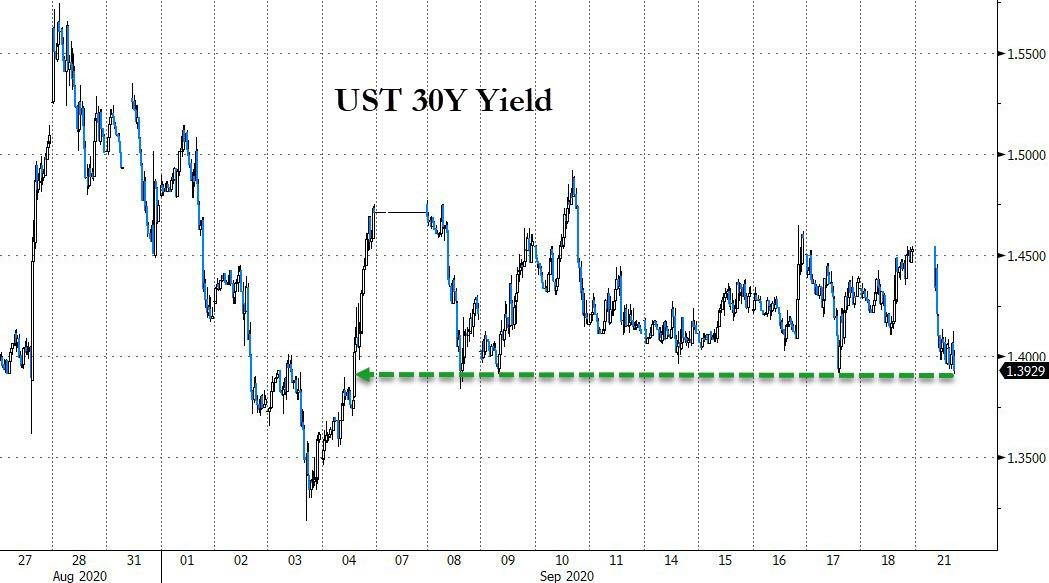
Regarding the markets, there was no place to hide with the Dollar surging, which sent gold reeling, while stocks and bond yields tumbled.
It remains to be seen how much more downside momentum lies ahead of us, or of this will be close to the bottom. Does not matter, as in these uncertain times, I think it’s wise to be a little cautious, rather than reckless, when it comes to market exposure.
2. ETFs in the Spotlight
In case you missed the announcement and description of this section, you can read it here again.
It features some of the 10 broadly diversified domestic and sector ETFs from my HighVolume list as posted every Saturday. Furthermore, they are screened for the lowest MaxDD% number meaning they have been showing better resistance to temporary sell offs than all others over the past year.
The below table simply demonstrates the magnitude with which these ETFs are fluctuating above or below their respective individual trend lines (%+/-M/A). A break below, represented by a negative number, shows weakness, while a break above, represented by a positive percentage, shows strength.
For hundreds of ETF choices, be sure to reference Thursday’s StatSheet.
For this current domestic “Buy” cycle, here’s how some our candidates have fared:
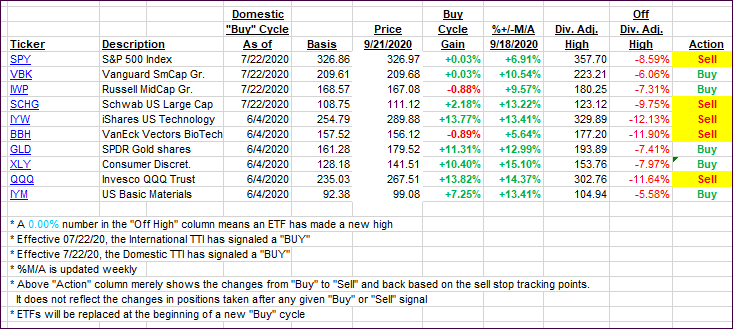
Click image to enlarge
Again, the %+/-M/A column above shows the position of the various ETFs in relation to their respective long-term trend lines, while the trailing sell stops are being tracked in the “Off High” column. The “Action” column will signal a “Sell” once the -8% point has been taken out in the “Off High” column. For more volatile sector ETFs, the trigger point is -10%.
3. Trend Tracking Indexes (TTIs)
Our TTIs took a dive as today’s market dump was broad based.
This is how we closed 09/21/2020:
Domestic TTI: +3.33% above its M/A (prior close +6.48%)—Buy signal effective 07/22/2020
International TTI: +2.42% above its M/A (prior close +5.22%)—Buy signal effective 07/22/2020
Disclosure: I am obliged to inform you that I, as well as my advisory clients, own some of the ETFs listed in the above table. Furthermore, they do not represent a specific investment recommendation for you, they merely show which ETFs from the universe I track are falling within the specified guidelines.
Contact Ulli