
- Moving the markets
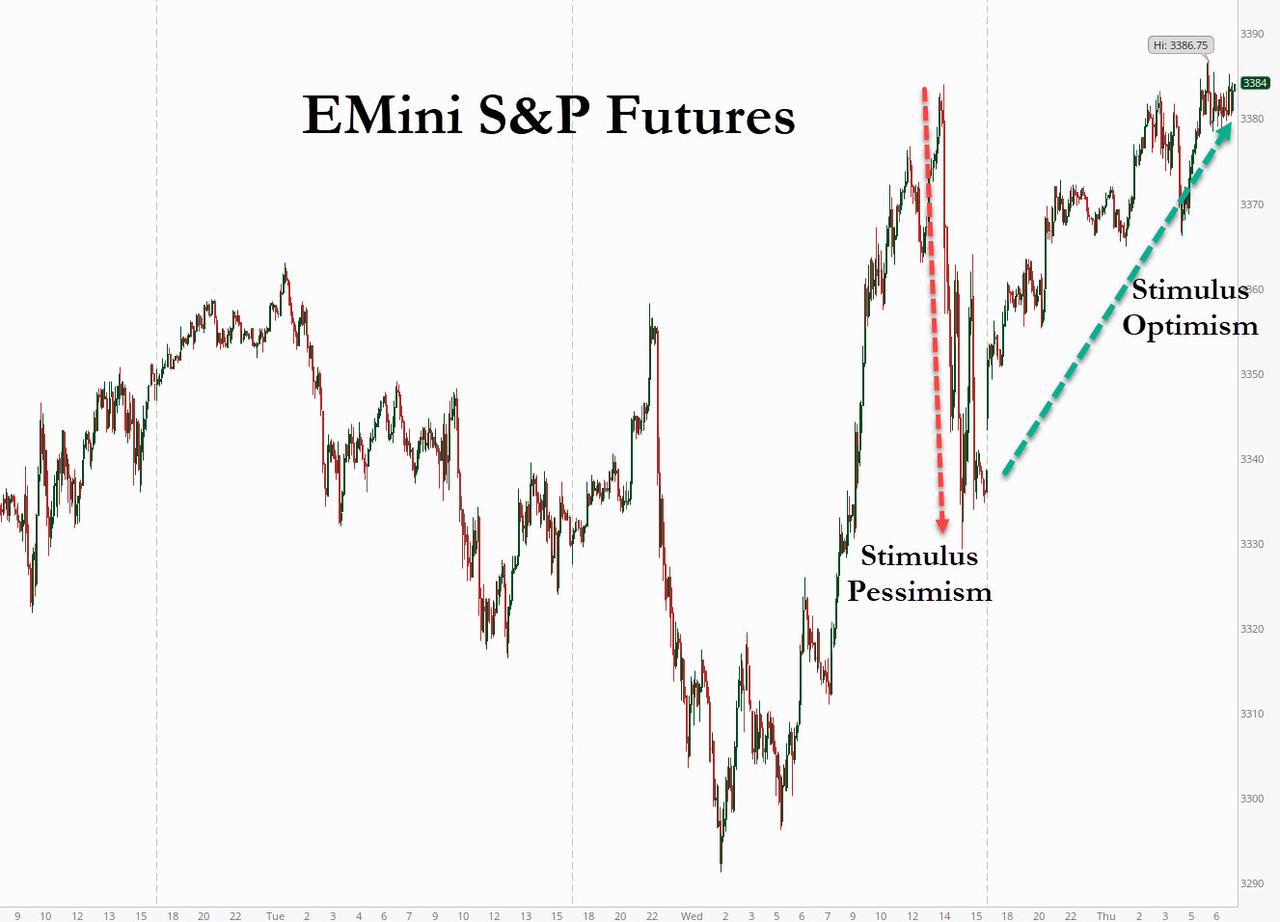
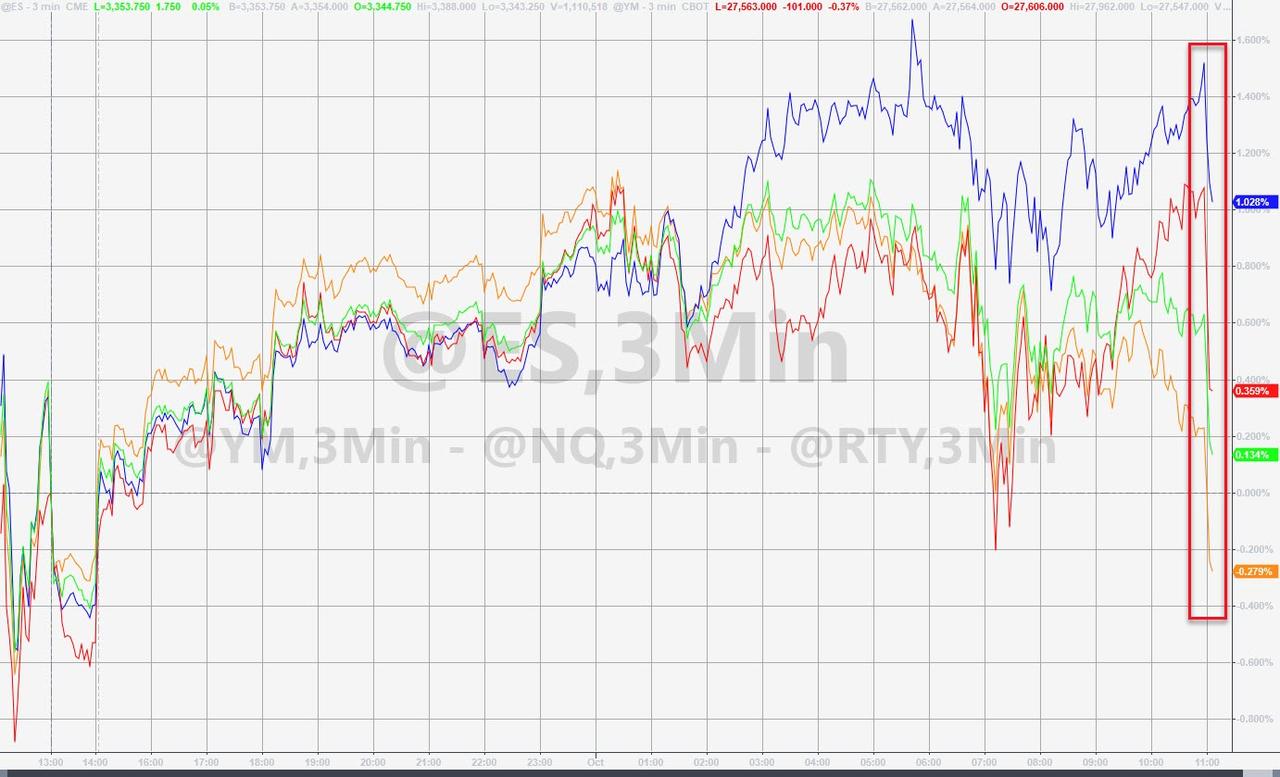
The futures market already fluctuated between stimulus pessimism and optimism causing the S&P to oscillate wildly, as this chart shows.
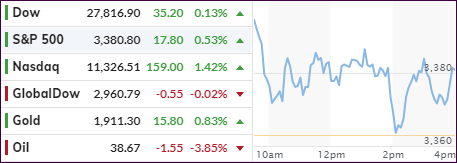
The regular session continued with that volatile theme when, similarly to yesterday, an early rally hit a brick wall with the indexes resembling a roller-coaster ride. The exception was the Nasdaq, which continued its northerly path without interruption, while the Dow dipped in and out of the red during the last couple of hours.
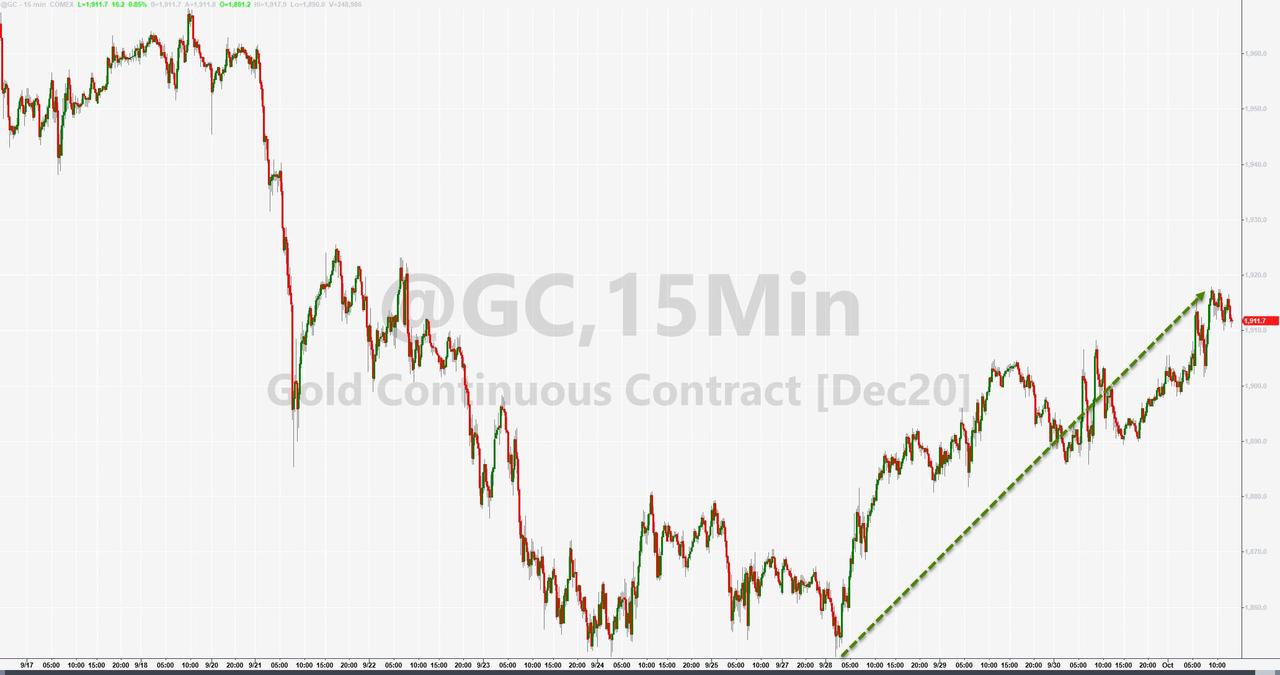
A buying surge into the close assured green numbers all around, with especially Gold sporting a nice comeback.
The sudden plunge mid-day occurred because of house stimulus headlines with Pelosi declaring the difference is ‘not dollars, but value’…
Added ZH:
AS a reminder, yesterday the House had delayed the vote by one day as a concession to the ongoing dialog between Secretary Mnuchin and Nancy Pelosi. However, the fact that the House speaker now plans to ram through the vote confirms what should have been obvious weeks ago- that no agreement has been reached and that no agreement will likely be reached until after the election.
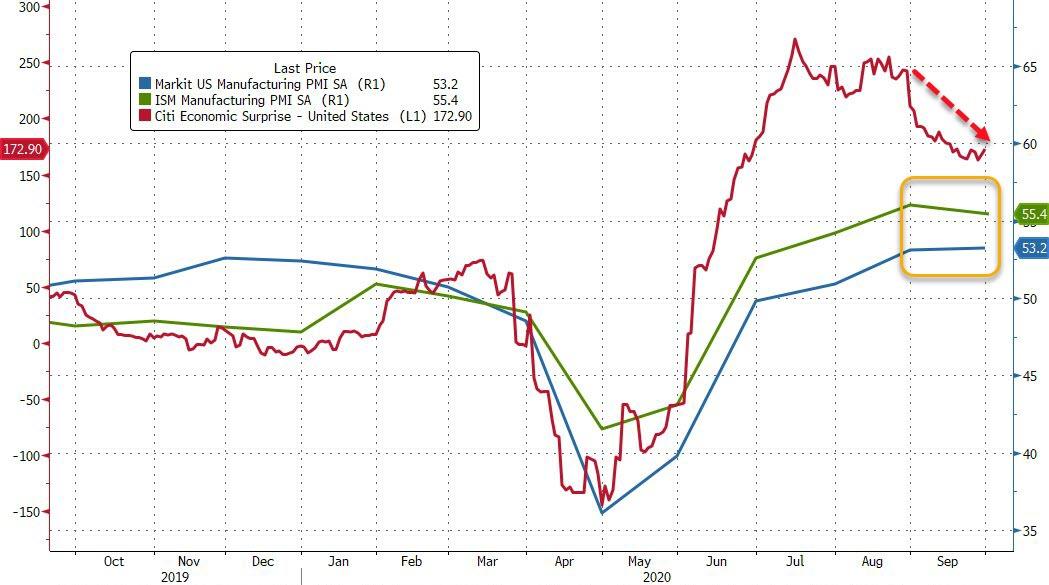
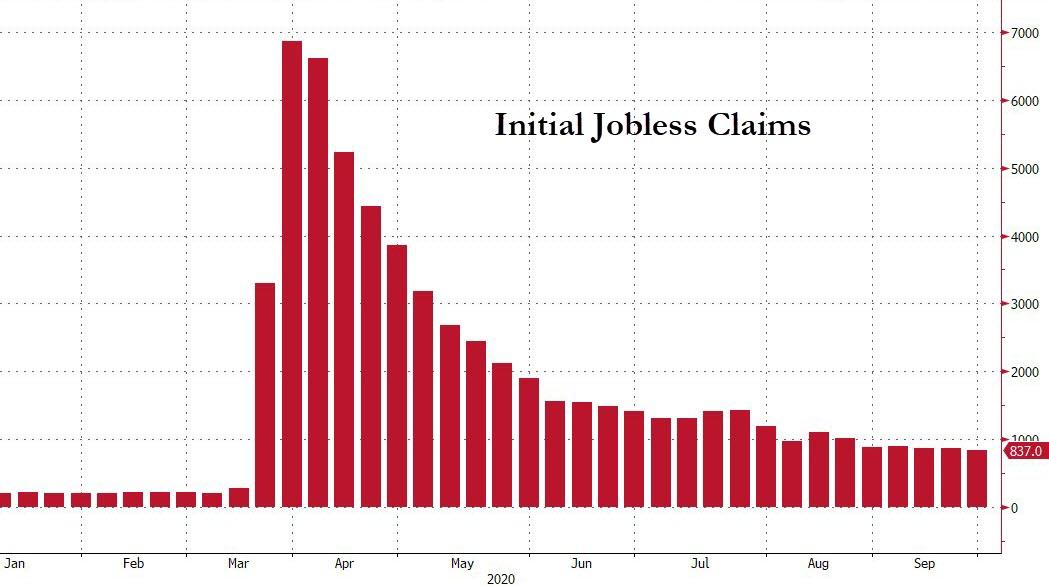
On the economic front, the picture remains mixed at best with the US Manufacturing Survey suggesting that “The Outlook Has Darkened,” according to ZH. The filing for First-Time Jobless Benefits, while slightly improved from last week, still shows an economic environment in trouble. The fly in the ointment is that California announced a two-week pause in the processing of initial claims. Hmmm…
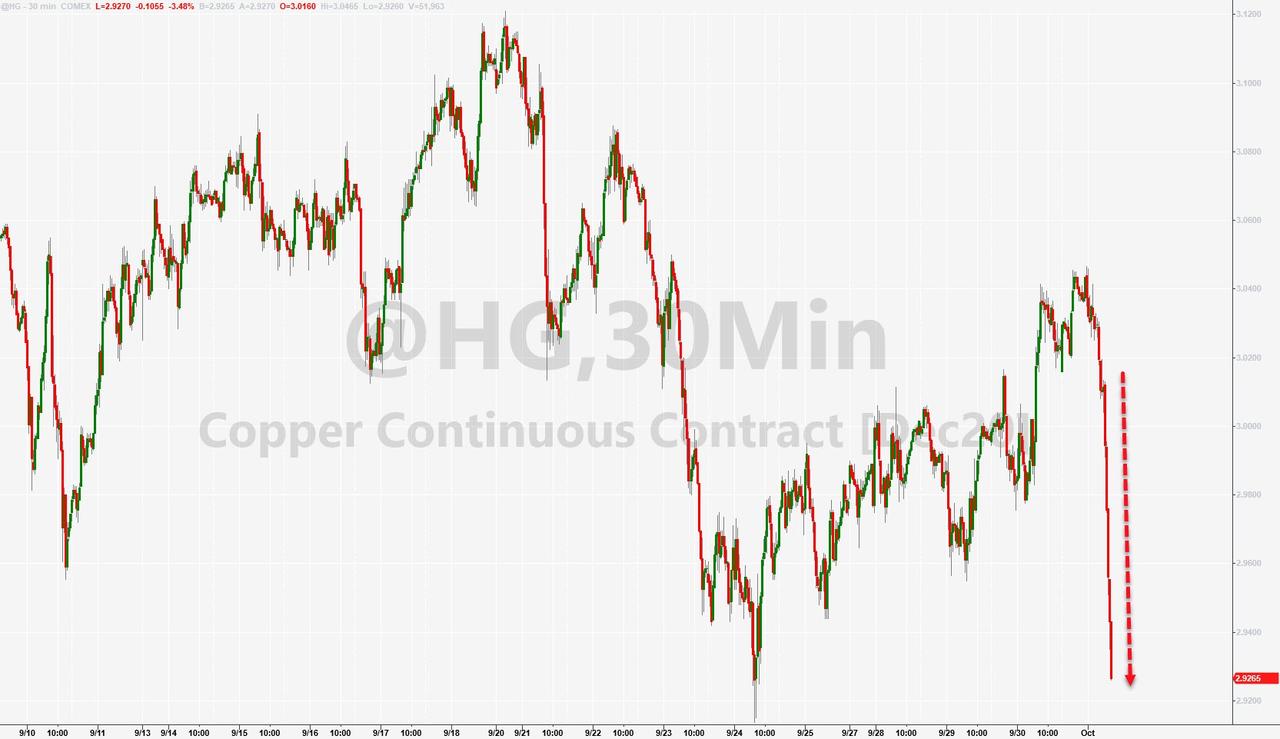
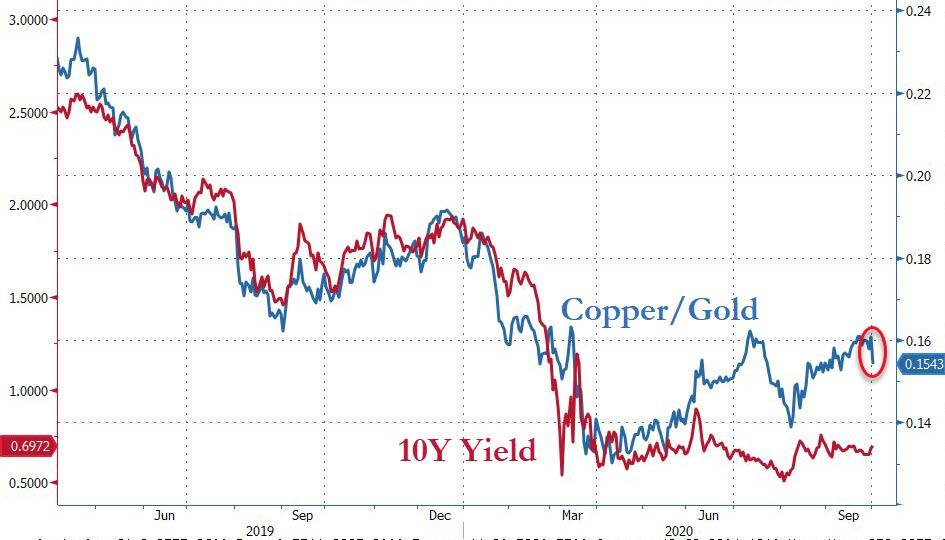
All these questionable numbers have not been lost on Dr. Copper, the metal which often acts as a proxy for the economy, but its latest plunge could serve notice that not all is well, and that it has a long way to fall to catch up with the reality of bonds. Hat tip goes to Bloomberg for this graph.
2. ETFs in the Spotlight
In case you missed the announcement and description of this section, you can read it here again.
It features some of the 10 broadly diversified domestic and sector ETFs from my HighVolume list as posted every Saturday. Furthermore, they are screened for the lowest MaxDD% number meaning they have been showing better resistance to temporary sell offs than all others over the past year.
The below table simply demonstrates the magnitude with which these ETFs are fluctuating above or below their respective individual trend lines (%+/-M/A). A break below, represented by a negative number, shows weakness, while a break above, represented by a positive percentage, shows strength.
For hundreds of ETF choices, be sure to reference Thursday’s StatSheet.
For this current domestic “Buy” cycle, here’s how some our candidates have fared:
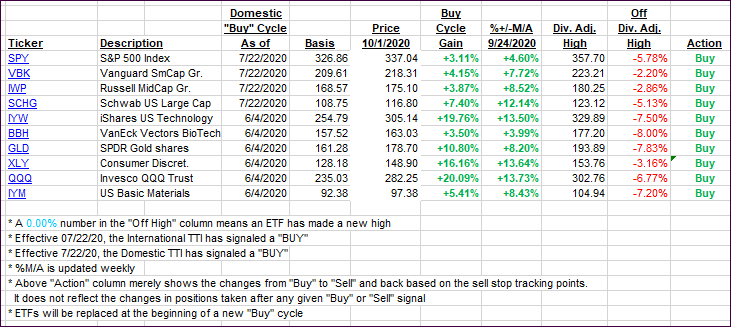
Click image to enlarge
Again, the %+/-M/A column above shows the position of the various ETFs in relation to their respective long-term trend lines, while the trailing sell stops are being tracked in the “Off High” column. The “Action” column will signal a “Sell” once the -8% point has been taken out in the “Off High” column. For more volatile sector ETFs, the trigger point is -10%.
3. Trend Tracking Indexes (TTIs)
Our TTIs were mixed with the Domestic one advancing, while the International one remained unchanged.
This is how we closed 10/01/2020:
Domestic TTI: +5.88% above its M/A (prior close +5.50%)—Buy signal effective 07/22/2020
International TTI: +2.74% above its M/A (prior close +2.74%)—Buy signal effective 07/22/2020
Disclosure: I am obliged to inform you that I, as well as my advisory clients, own some of the ETFs listed in the above table. Furthermore, they do not represent a specific investment recommendation for you, they merely show which ETFs from the universe I track are falling within the specified guidelines.
Contact Ulli