
- Moving the markets
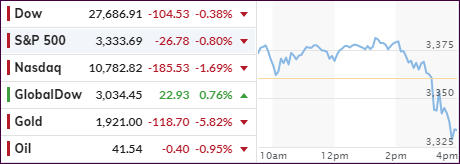
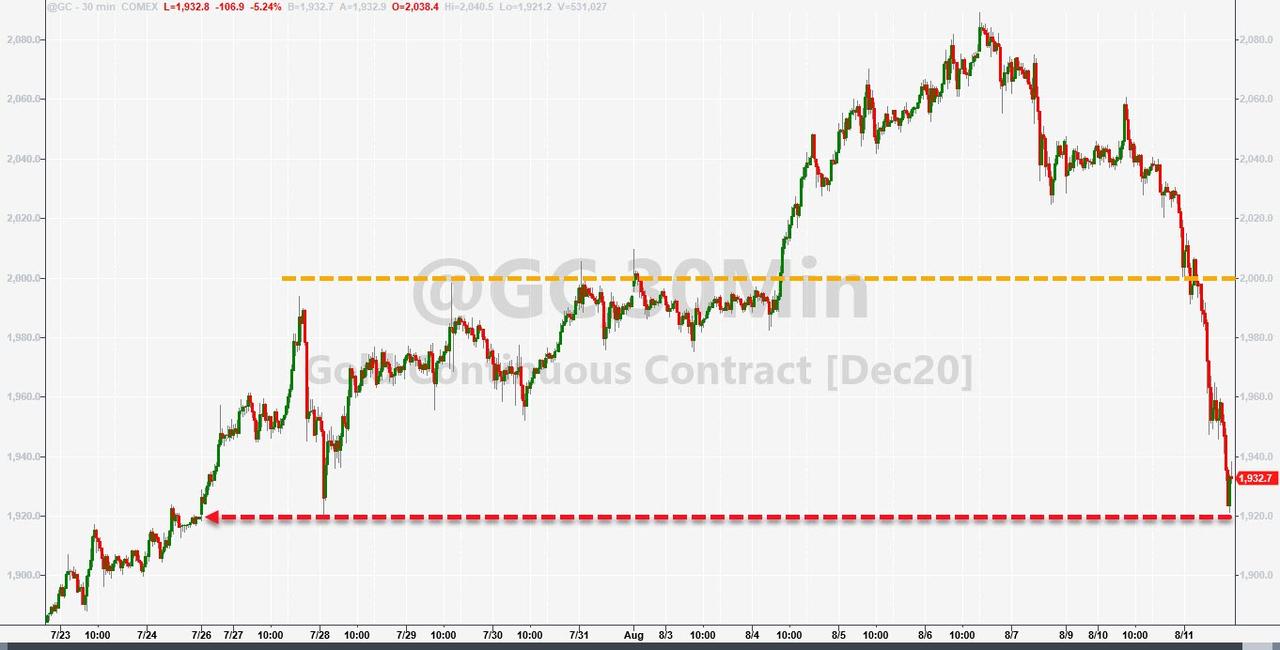
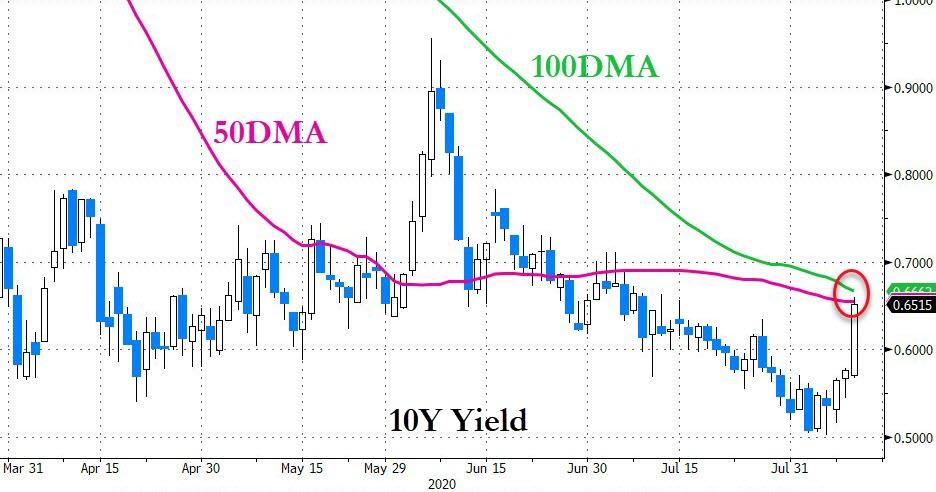
For sure, it was a market where anything was possible. The Dow reigned supreme for most of the day, with a 300-point advance at one point, while the S&P 500 cruised slightly above its unchanged line. Gold and the tech sector plunged, with especially the former getting hurt by rising yields as bond prices crumbled but reversed a bit late in the session.
Things changed in the afternoon when all rebound efforts failed and the major indexes, including the Dow, went into swan dive mode and headed sharply south.
Traders were not sure about the outlook for the economy, despite slowing new coronavirus cases. However, the lack of progress in Washington toward additional aid soured the mood, and down we went.
Of course, after the sizzling ramp in gold and tech over the past weeks, a pause was to be expected. It remains to be seen whether today was just an outlier, or the beginning of more liquidation, as all asset classes puked in sync.
Quipped ZH:
And one wonders if the ‘dead cat bounce’ is over (if nothing else, today’s reversal is interestingly timed):
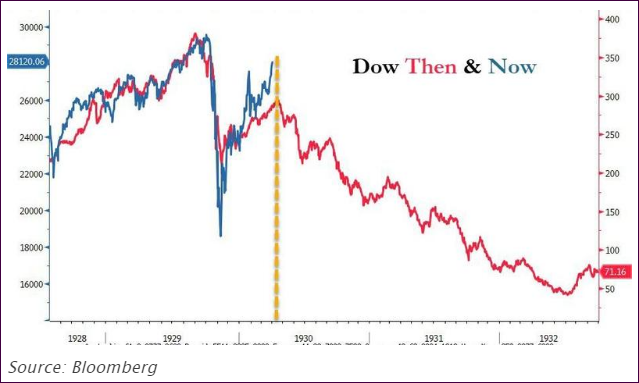
We will find out soon enough how this analog to the 1930s plays out. Just in case, have an exit strategy in place.
2. ETFs in the Spotlight
In case you missed the announcement and description of this section, you can read it here again.
It features some of the 10 broadly diversified domestic and sector ETFs from my HighVolume list as posted every Saturday. Furthermore, they are screened for the lowest MaxDD% number meaning they have been showing better resistance to temporary sell offs than all others over the past year.
The below table simply demonstrates the magnitude with which these ETFs are fluctuating above or below their respective individual trend lines (%+/-M/A). A break below, represented by a negative number, shows weakness, while a break above, represented by a positive percentage, shows strength.
For hundreds of ETF choices, be sure to reference Thursday’s StatSheet.
For this current domestic “Buy” cycle, here’s how some our candidates have fared:
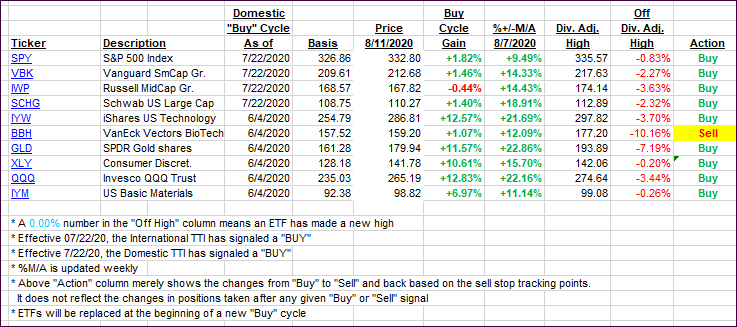
Click image to enlarge
Again, the %+/-M/A column above shows the position of the various ETFs in relation to their respective long-term trend lines, while the trailing sell stops are being tracked in the “Off High” column. The “Action” column will signal a “Sell” once the -8% point has been taken out in the “Off High” column. For more volatile sector ETFs, the trigger point is -10%.
3. Trend Tracking Indexes (TTIs)
Our TTIs showed a mixed picture with the Domestic one barely moving, while the International took a big jump deeper into bullish territory.
This is how we closed 08/11/2020:
Domestic TTI: +7.03% above its M/A (prior close +7.14%)—Buy signal effective 07/22/2020
International TTI: +4.28% above its M/A (prior close +3.42%)—Buy signal effective 07/22/2020
Disclosure: I am obliged to inform you that I, as well as my advisory clients, own some of the ETFs listed in the above table. Furthermore, they do not represent a specific investment recommendation for you, they merely show which ETFs from the universe I track are falling within the specified guidelines.
Contact Ulli