
- Moving the markets
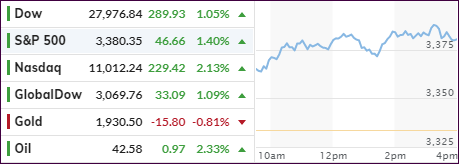
Yesterday’s sell-off now appears in the rear-view mirror as a vanishing object, as the major indexes stormed back and ended solidly in the green. The S&P 500 closed just shy of a new record, although it broke the old high set on February 19 on an intra-day basis.
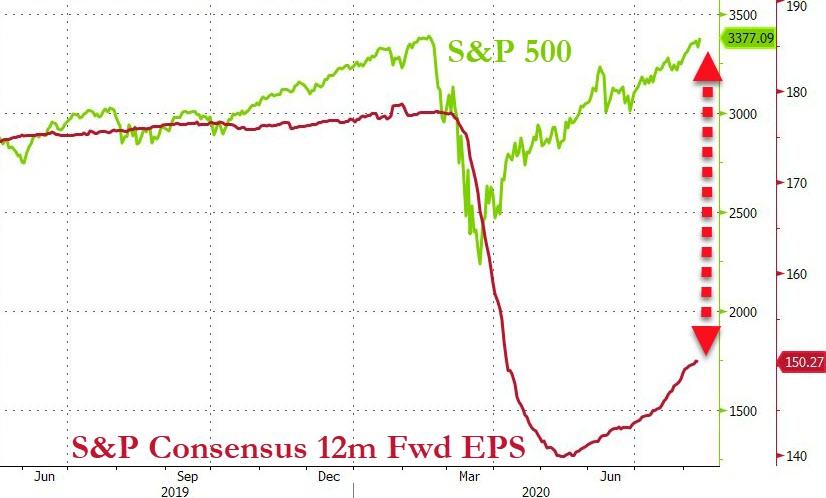
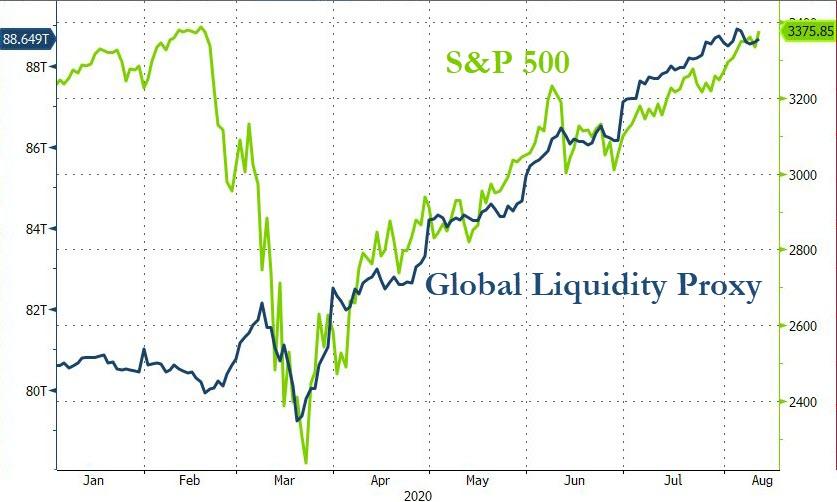
Surely, the move was not based on fundamentals, which are way out of whack, as Bloomberg demonstrates here, while explaining the real reason in this chart. Of course, for readers of this blog, this is nothing new but merely a refresher.
Gold lagged the entire session, thanks to higher bond yields, and pulled back into close to end the day in the red. Reviewing yesterday’s performance, and the importance of gold in the bigger picture, was Rabobank’s Michael Every:
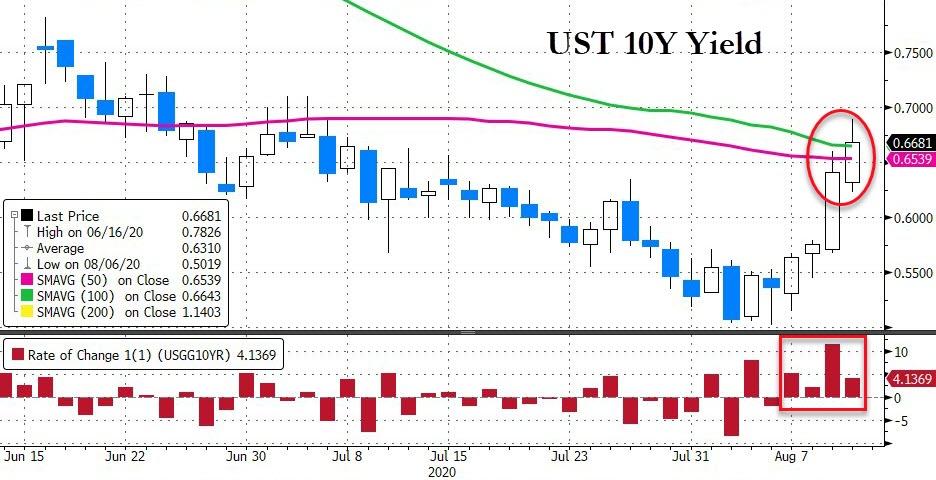
Meanwhile, markets did wobble yesterday for entirely different reasons, with one of the key ones being that 10-year US Treasuries are now back up to 0.65%, which makes holding everything else that much less attractive. Including gold, which was supposed to be showing us that inflation was everywhere ahead (not just in assets) and that the USD was over. Yes, being below $1,900 and not above $2,000 is just a small detail in a far bigger picture, but it does underline that nothing is rock solid day-to-day – even metal.
That the precious metal will have a great future was further underscored today, as news that the Budget Deficit has hit a record caused ZH to comment:
On a YTD basis, 10 months into the 2020 fiscal year, the US has spent $5.631 trillion and collected just $2.824 trillion, which means that YTD outlays are a record 100% higher than receipts, which also includes the $8.3BN received last month and $63.4BN YTD in deposits of earnings by the Fed.
Ouch! And considering that this trend will not end soon, gold remains an important component in everyone’s portfolio, but it also means that sharp corrections will be inevitable.
Author and gold bug Peter Schiff saw yesterday’s sell-off this way:
What the market is doing is trying to flush out the weaker players. When it comes to a bear market, it’s trying to create some hope and sucker people back into the market by having a really big rally. Well, in a bull market it’s the opposite. The market is trying to instill fear in the weaker hands, so you get these spectacular one-day moves in the opposite direction of the primary trend to shake people out, to get the weaker players out of the market so you can clear away the excess baggage and then continue the trend.
In the meantime, equities remain in bullish mode, despite the Washington stalemate about a new coronavirus package with legal challenges about Trump’s executive orders to extend spending measures waiting on deck.
2. ETFs in the Spotlight
In case you missed the announcement and description of this section, you can read it here again.
It features some of the 10 broadly diversified domestic and sector ETFs from my HighVolume list as posted every Saturday. Furthermore, they are screened for the lowest MaxDD% number meaning they have been showing better resistance to temporary sell offs than all others over the past year.
The below table simply demonstrates the magnitude with which these ETFs are fluctuating above or below their respective individual trend lines (%+/-M/A). A break below, represented by a negative number, shows weakness, while a break above, represented by a positive percentage, shows strength.
For hundreds of ETF choices, be sure to reference Thursday’s StatSheet.
For this current domestic “Buy” cycle, here’s how some our candidates have fared:
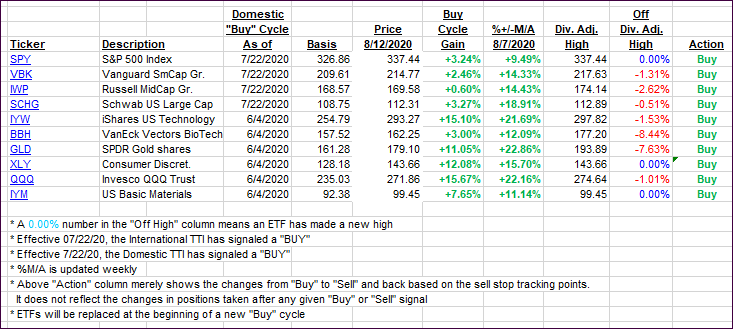
Click image to enlarge
Again, the %+/-M/A column above shows the position of the various ETFs in relation to their respective long-term trend lines, while the trailing sell stops are being tracked in the “Off High” column. The “Action” column will signal a “Sell” once the -8% point has been taken out in the “Off High” column. For more volatile sector ETFs, the trigger point is -10%.
3. Trend Tracking Indexes (TTIs)
Our TTIs were in sync today with the Domestic one advancing, while the International took a jump showing more bullish momentum.
This is how we closed 08/12/2020:
Domestic TTI: +7.66% above its M/A (prior close +7.03%)—Buy signal effective 07/22/2020
International TTI: +5.49% above its M/A (prior close +4.28%)—Buy signal effective 07/22/2020
Disclosure: I am obliged to inform you that I, as well as my advisory clients, own some of the ETFs listed in the above table. Furthermore, they do not represent a specific investment recommendation for you, they merely show which ETFs from the universe I track are falling within the specified guidelines.
Contact Ulli